Fig. 7
Download original image
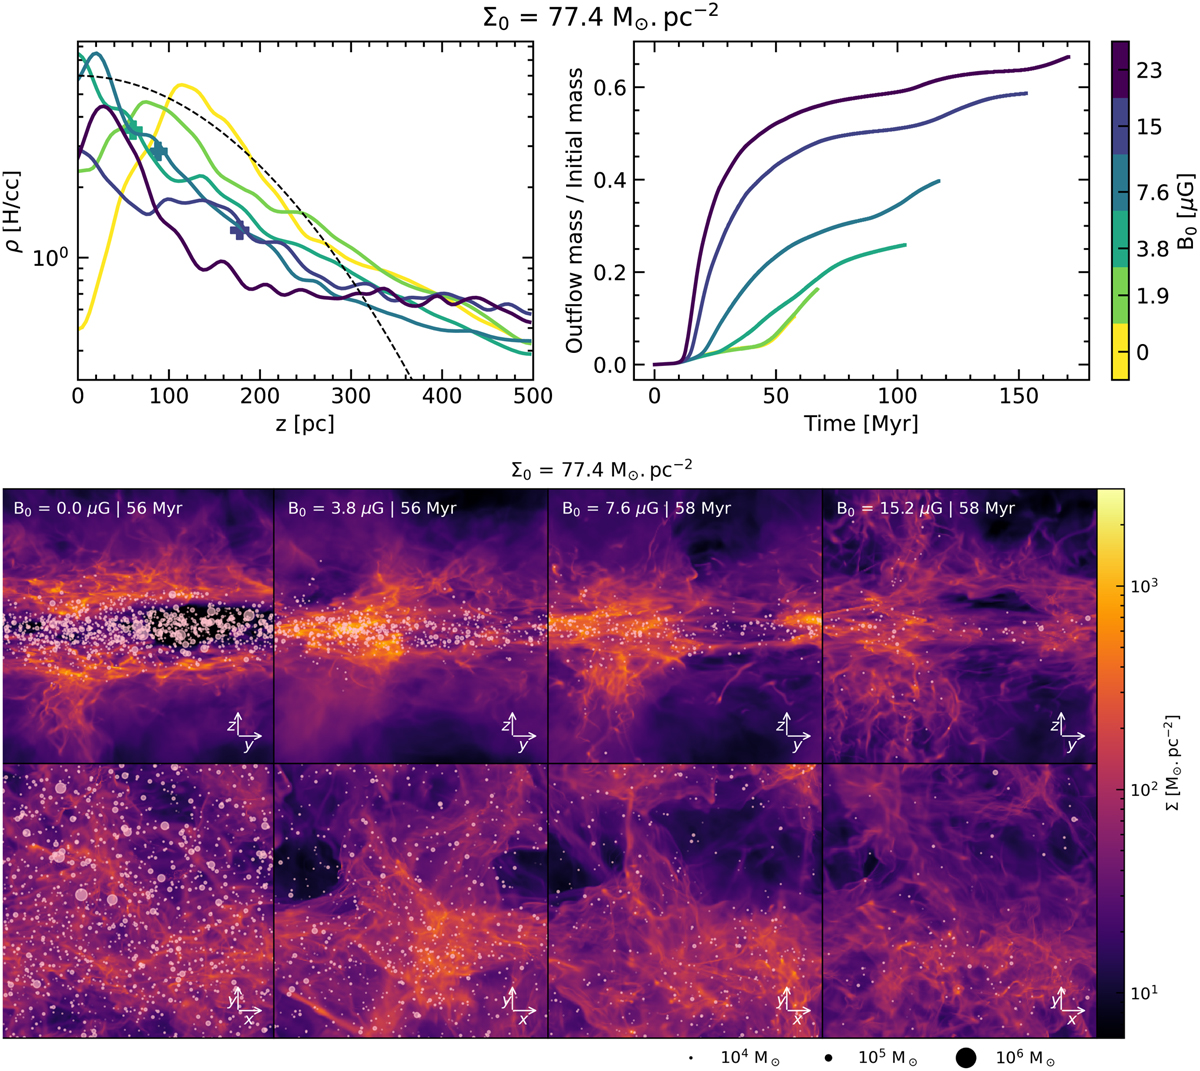
Effect of the magnetic field on the structure of the disk and the outflows (group MAG) for a high column density. Top left panel: averaged density profile (slightly smoothed for readability) at t ≈ 58 Myr. For runs in which the midplane density was close to the maximum density, the position at which the density is half of the midplane density is marked with a plus. The dashed black line corresponds to the initial profile. The colours of the lines refer to the same colour bar as in the plot of the top right panel. Top right panel: mass loss via outflows through the open up and down boundaries. Lower panel: edge-on (top) and face-on (bottom) column densities.
Current usage metrics show cumulative count of Article Views (full-text article views including HTML views, PDF and ePub downloads, according to the available data) and Abstracts Views on Vision4Press platform.
Data correspond to usage on the plateform after 2015. The current usage metrics is available 48-96 hours after online publication and is updated daily on week days.
Initial download of the metrics may take a while.