Fig. 2
Download original image
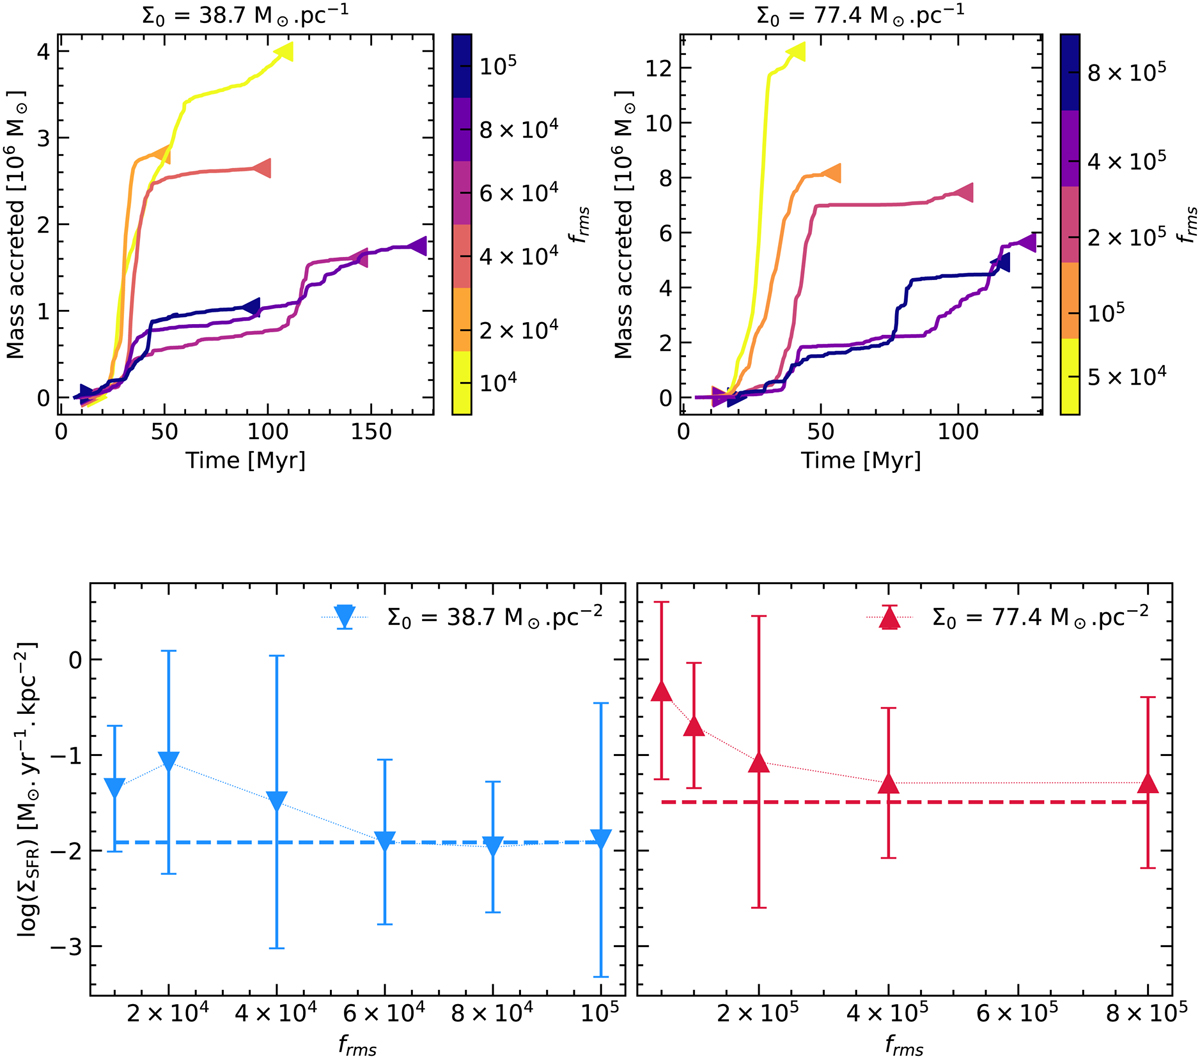
Effect of the intensity of the turbulent driving on the SFR (group STRENGTH). frms is a measure of the driving strength. More precisely, frms is the RMS acceleration of the force density in code units. Top: mass accreted in sinks. The SFR computation started when 3% were consumed or lost (t3%, left triangle) and ended when 40% of gas was consumed or lost (t40%, right triangle). Bottom: surface density of the SFR as a function of the strength of the driving frms. The plotted value is the accretion rate between t3% and t40%, and the error bars reflect the standard deviation of all the accretion rates we obtained by choosing starting and end points between these two values. The dashed line is the value of the SFR given by the SK relation (Kennicutt & Evans 2012).
Current usage metrics show cumulative count of Article Views (full-text article views including HTML views, PDF and ePub downloads, according to the available data) and Abstracts Views on Vision4Press platform.
Data correspond to usage on the plateform after 2015. The current usage metrics is available 48-96 hours after online publication and is updated daily on week days.
Initial download of the metrics may take a while.