Fig. 12
Download original image
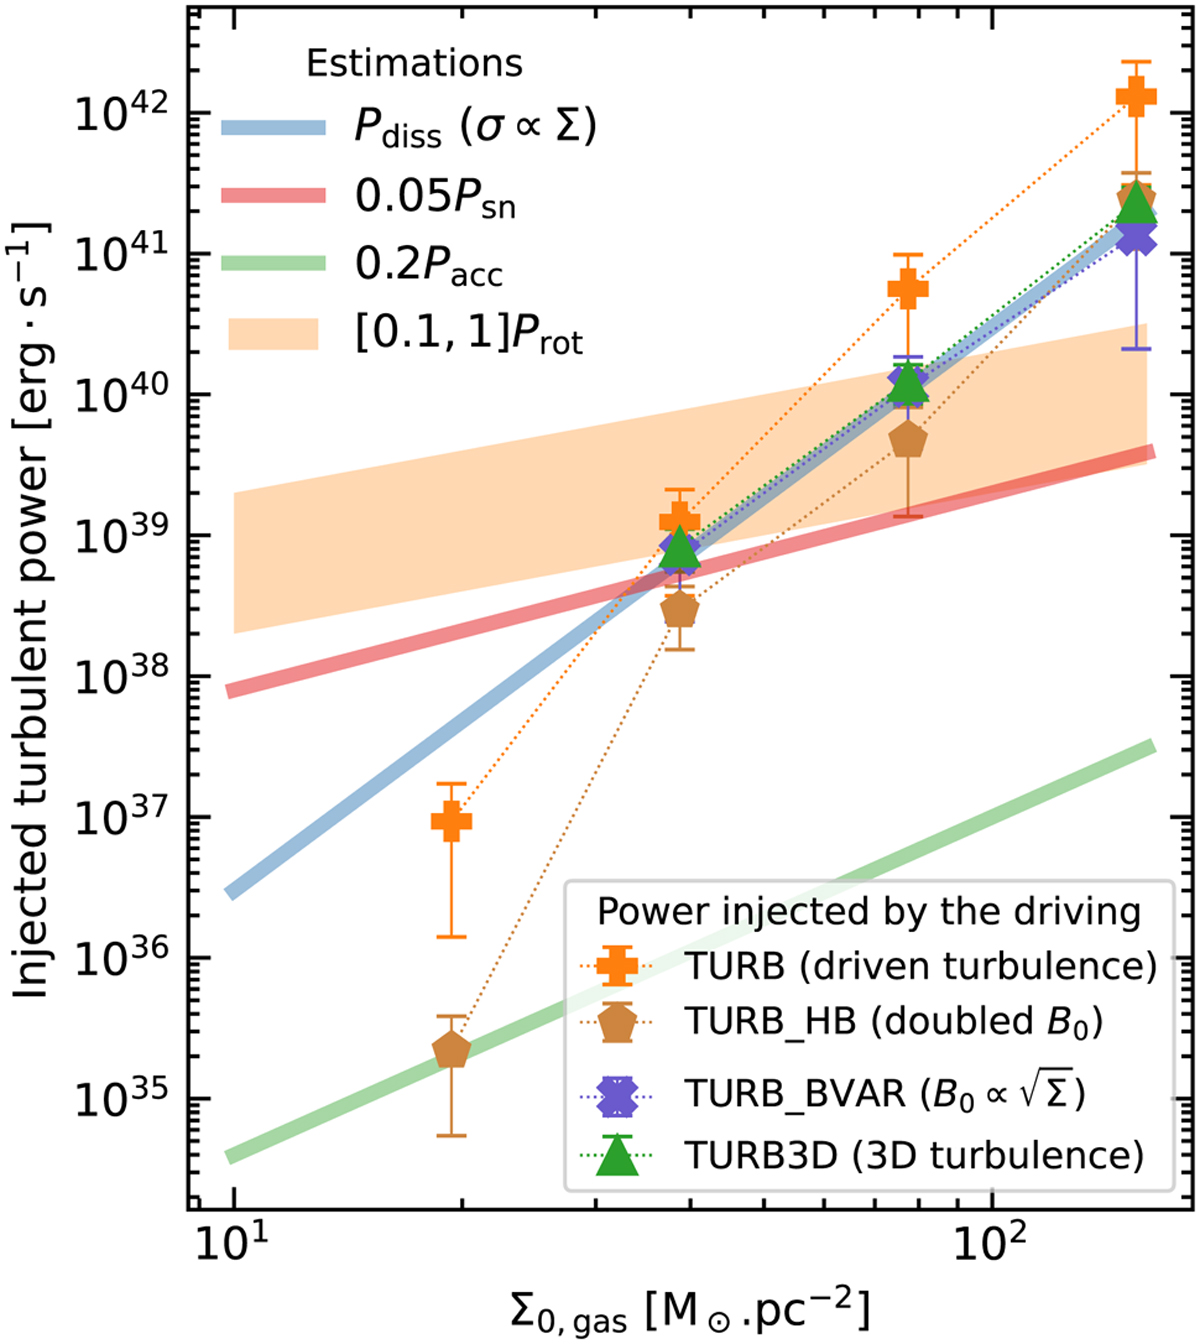
Power injected by the turbulent driving in the simulations compared with estimations. Markers represent the time-averaged power injected by the turbulent driving force in order to reproduce the SK relation. The power is computed in the whole simulation box and averaged between 4 and 60 Myr. In these simulations, the driving strength was calibrated so that the SFR was close to the SK relation (see Sect. 6.2 and 6.3, as well as Figs. 10 and 11). The mean value is the total energy injected during the period divided by the time span, while the error bar is the standard deviation from the power computed at each time step. The solid lines refer to the estimates of the possible source of turbulent driving, and the notation is the same as in Sect. 2. The efficiency coefficients (ϵsn ~ 0.05, ϵacc ~ 0.2, ϵrot ϵ [0.1, 1]) are reasonable estimates, as discussed in Sect. 2 as well. To draw the blue line, we assumed that the velocity dispersion was proportional to the column density.
Current usage metrics show cumulative count of Article Views (full-text article views including HTML views, PDF and ePub downloads, according to the available data) and Abstracts Views on Vision4Press platform.
Data correspond to usage on the plateform after 2015. The current usage metrics is available 48-96 hours after online publication and is updated daily on week days.
Initial download of the metrics may take a while.