Fig. 4
Download original image
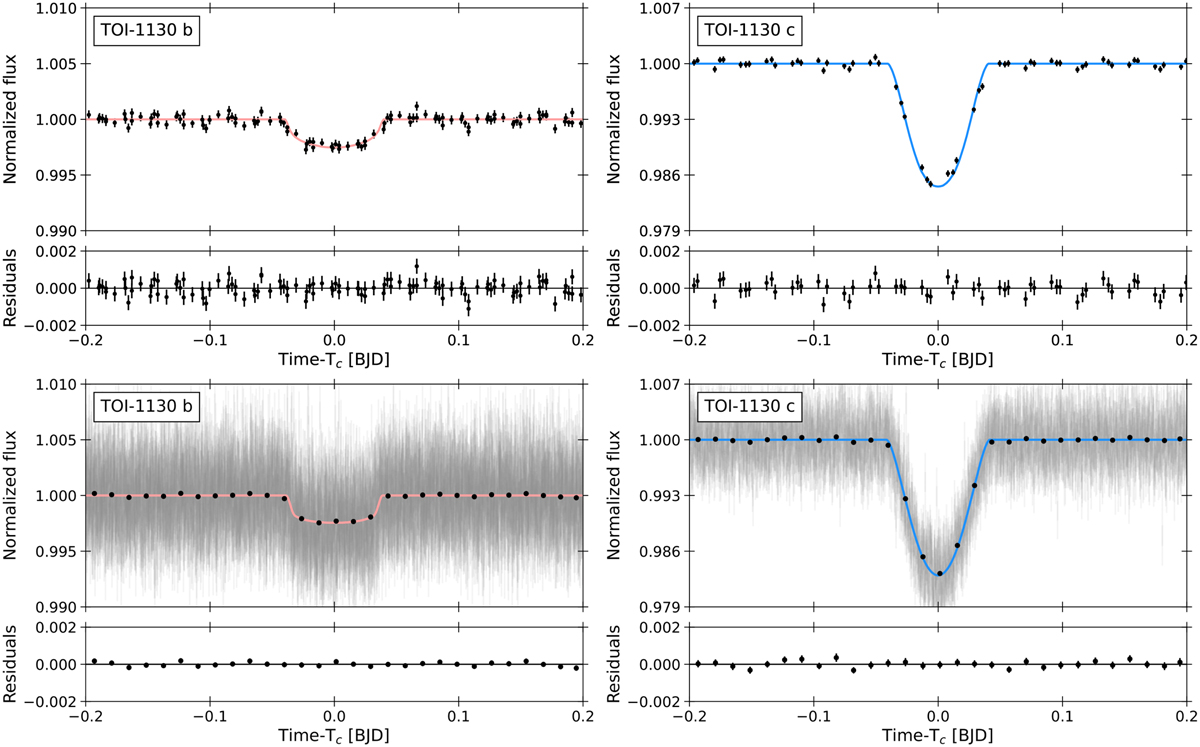
Phase-folded TESS transit light curves for TOI-1130 b (left) and for TOI 1130 c (right) accounting for the transit timing variations. The best-fit PyTTV transit model (see Sect. 3.4) is overplotted for both TOI-1130 b and TOI-1130 c color-coded in salmon and blue, respectively. The upper panels show the light curves from Sector 13 observed in the 30-min cadence mode (black points) and the lower panels show the light curves from Sector 27 observed in the 20-s cadence mode (grey points) with a binning of 20 min (black points). Residuals are shown beneath each plot.
Current usage metrics show cumulative count of Article Views (full-text article views including HTML views, PDF and ePub downloads, according to the available data) and Abstracts Views on Vision4Press platform.
Data correspond to usage on the plateform after 2015. The current usage metrics is available 48-96 hours after online publication and is updated daily on week days.
Initial download of the metrics may take a while.