Fig. 2
Download original image
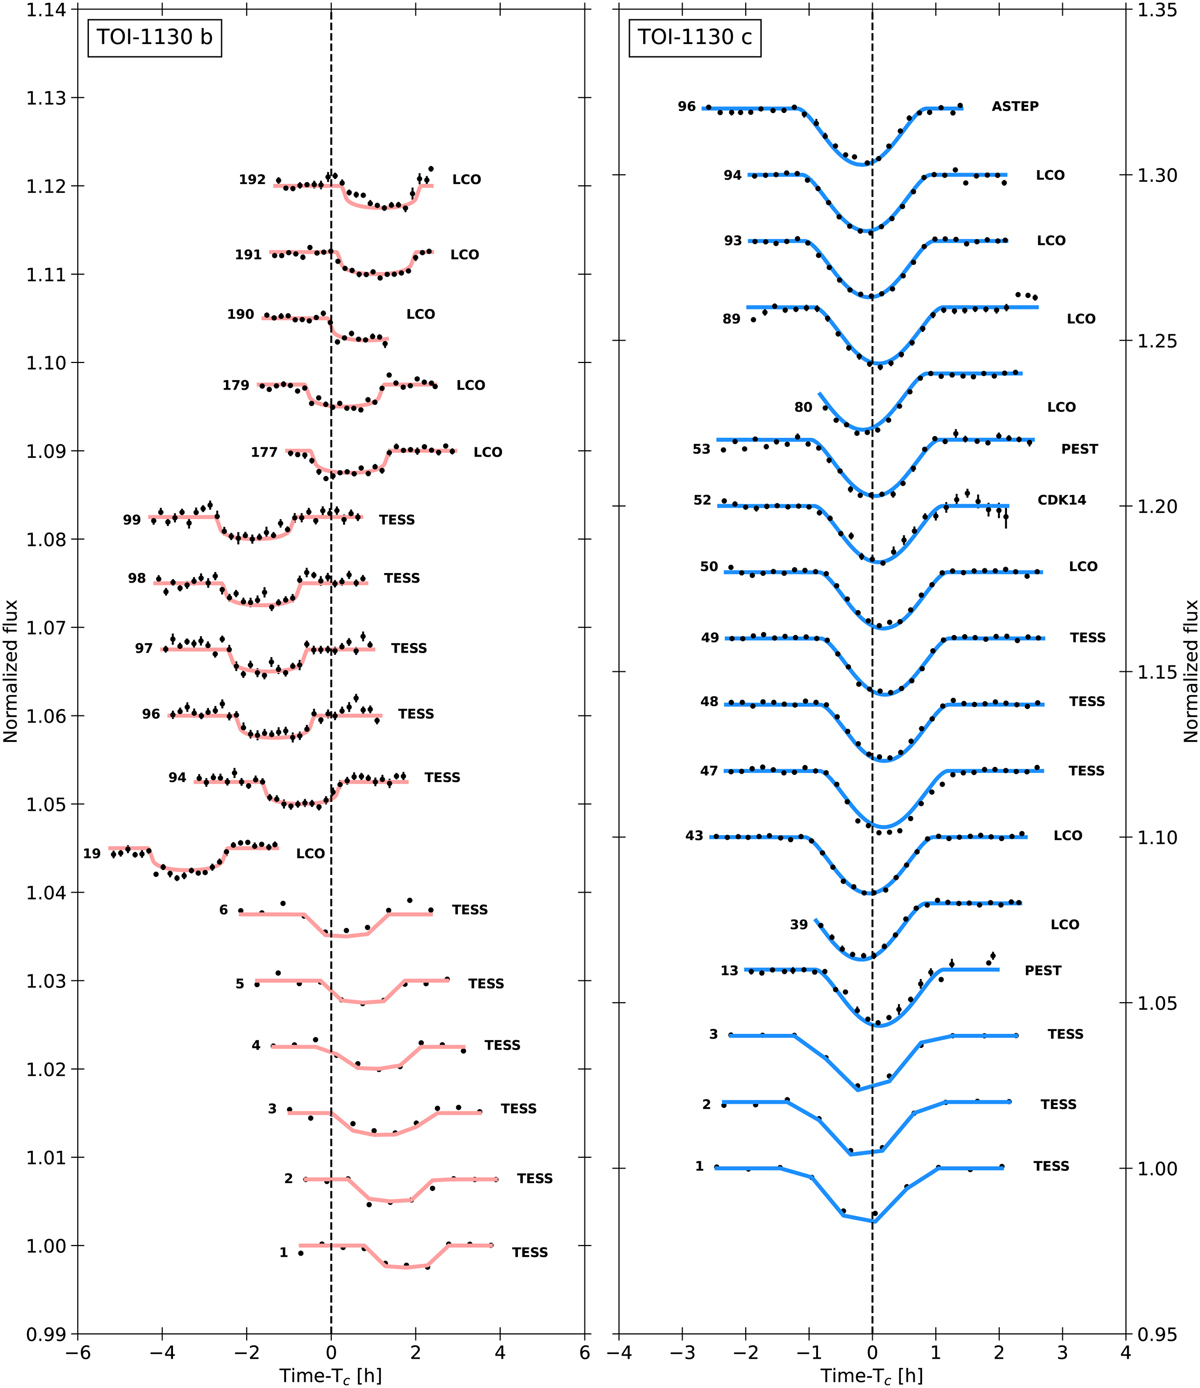
Detrended TESS and ground-based light curves for TOI-1130 b (left) and for TOI-1130 c (right). The light curves are shifted in phase according to the derived linear mean orbital period of each planet and shifted arbitrarily vertically for visibility. The corresponding transit number is shown on the left of each transit. For more details see Table 1. All light curves are binned to 10 min, except for the 30-min TESS light curves. The best-fit PyTTV transit model (see Sect. 3.4) is overplotted (TOI-1130 b: salmon and TOI-1130 c: blue). We note the different y-scales.
Current usage metrics show cumulative count of Article Views (full-text article views including HTML views, PDF and ePub downloads, according to the available data) and Abstracts Views on Vision4Press platform.
Data correspond to usage on the plateform after 2015. The current usage metrics is available 48-96 hours after online publication and is updated daily on week days.
Initial download of the metrics may take a while.