Fig. B.1
Download original image
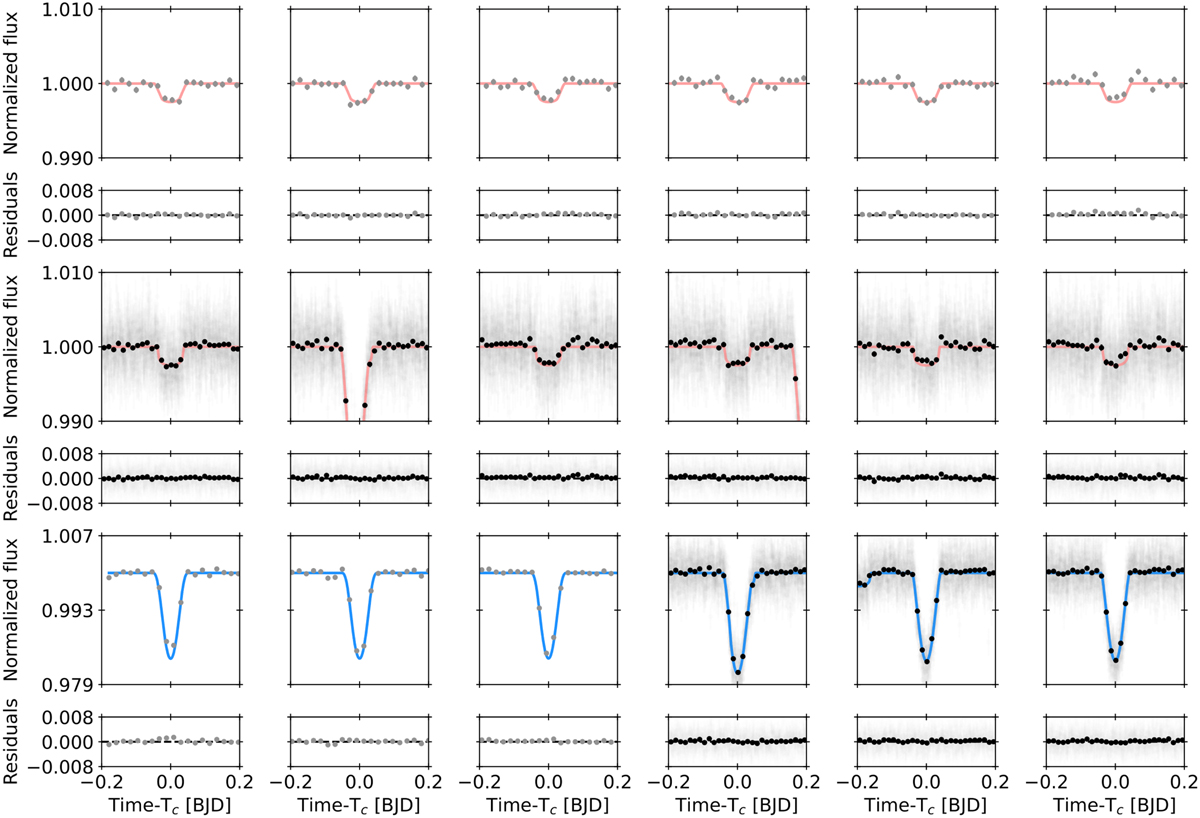
TESS transits of TOI-1130 b (upper two panels) and TOI-1130 c (lower panel) as used in the photodynamical modeling. Each transit is centred around the individual transit center times. The median PyTTV photodynamical model (see Sect. 3.5) is overplotted for both TOI-113 0 b and TOI-1130 c color-coded in salmon and blue, respectively. The light curves from Sector 27 are binned to 20-min (black points). Residuals are shown beneath each plot.
Current usage metrics show cumulative count of Article Views (full-text article views including HTML views, PDF and ePub downloads, according to the available data) and Abstracts Views on Vision4Press platform.
Data correspond to usage on the plateform after 2015. The current usage metrics is available 48-96 hours after online publication and is updated daily on week days.
Initial download of the metrics may take a while.