Fig. 1
Download original image
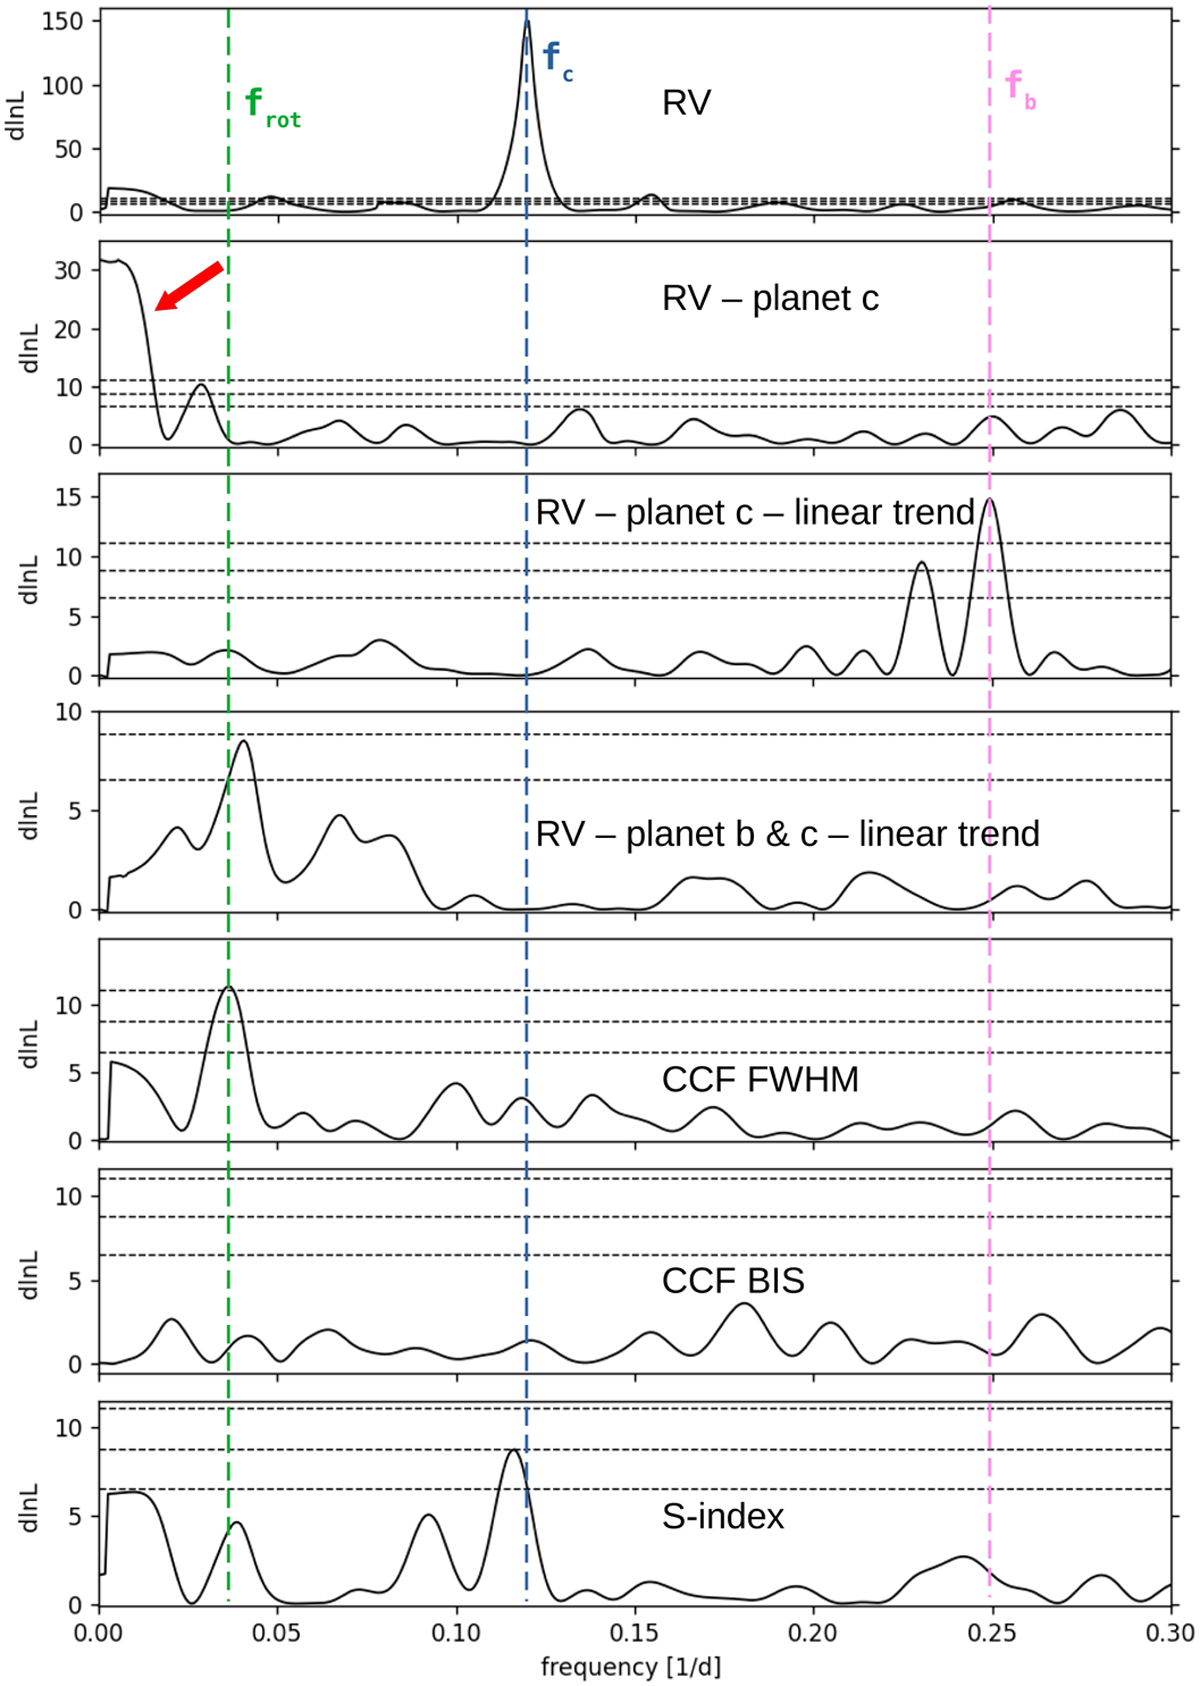
Maximum-likelihood periodograms of the HARPS+PSF RV measurements and HARPS activity indicators. The blue and salmon vertical dashed lines mark the orbital frequencies of the two transiting planets and the green vertical dashed line marks the rotation period of the star, while the horizontal dashed lines mark the 10 %, 1 %, and 0.1 % false alarm probability. From top to bottom: RV data; RV residuals after subtracting the signal of TOI-1130 c; RV residuals after subtracting the signal of TOI-1130 c and a linear trend; RV residuals after subtracting the signals of TOI-1130 b & c and a linear trend; FWHM and BIS of the CCF; and S-index. The red arrow in the third panel marks the excess of power at low frequencies significantly detected in the HARPS RVs.
Current usage metrics show cumulative count of Article Views (full-text article views including HTML views, PDF and ePub downloads, according to the available data) and Abstracts Views on Vision4Press platform.
Data correspond to usage on the plateform after 2015. The current usage metrics is available 48-96 hours after online publication and is updated daily on week days.
Initial download of the metrics may take a while.