Fig. 6
Download original image
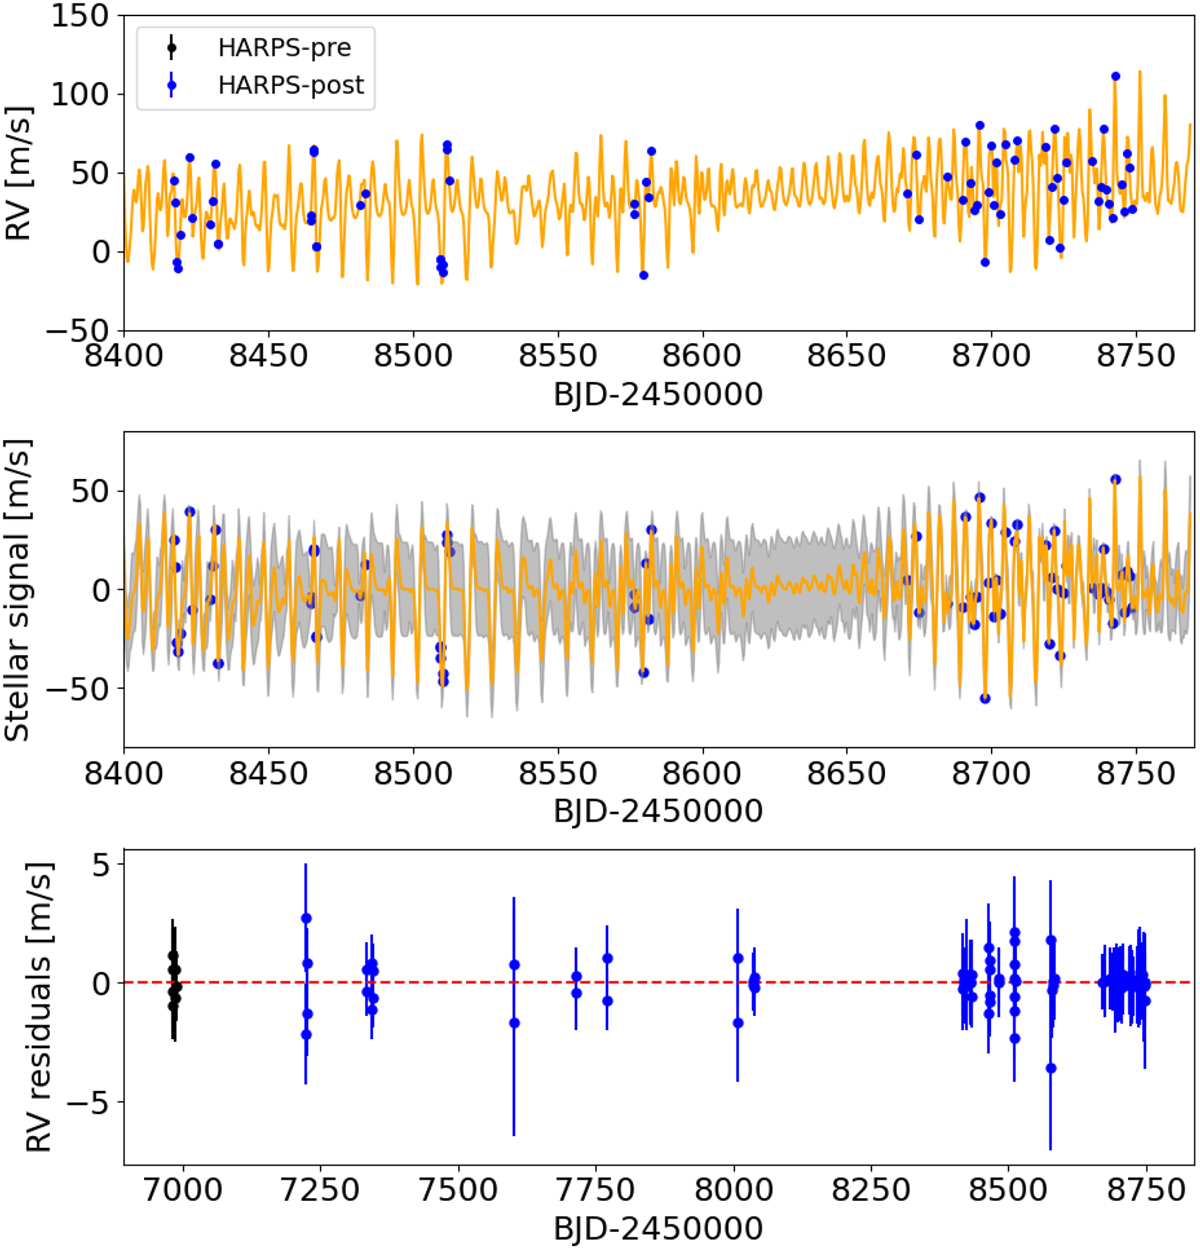
Best-fit results of the joint RV+TESS short-cadence light curve (Table 3). Top panel: original RVs with offsets removed (only HARPS-post RVs are shown for clarity). Middle panel: quasi-periodic stellar activity term (only HARPS-post RVs are shown for clarity). Bottom panel: RV residuals. The RV have been extracted with the pipeline TERRA, and error bars include the uncorrelated jitter terms added in quadrature to the formal uncertainties. The orange lines indicate the best-fit models: Keplerian+linear trend+stellar activity (top); stellar activity (middle). The gray shaded area in the middle panel gives the ±1σ uncertainty of the quasi-periodic activity signal.
Current usage metrics show cumulative count of Article Views (full-text article views including HTML views, PDF and ePub downloads, according to the available data) and Abstracts Views on Vision4Press platform.
Data correspond to usage on the plateform after 2015. The current usage metrics is available 48-96 hours after online publication and is updated daily on week days.
Initial download of the metrics may take a while.