Fig. 4
Download original image
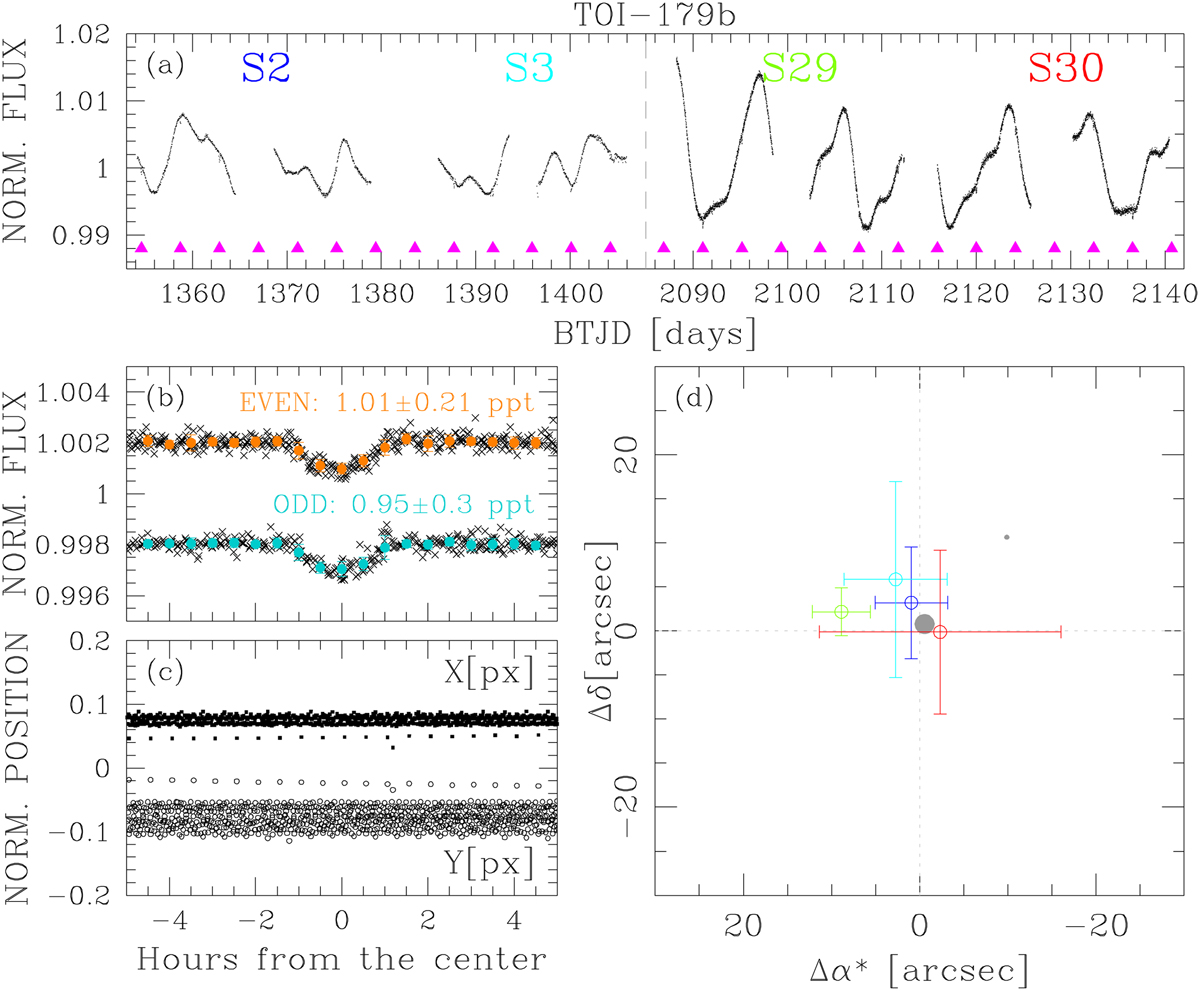
Overview of the vetting tests performed for TOI-179b using the TESS data. Panel a: flux-normalized light curve of TOI-179 obtained using the FFIs collected during Sectors 2, 3, 29, and 30 (magenta triangles indicate the transit events). Panel b: comparison between phased odd (cyan) and even (orange) transits. The points are the binned phased light curves, with bins of 0.5 h. Within the errors, odd and even transits have the same depths. Panel c: phased X and Y-positions. There is no correlation between the positions of the star in each image and the transit signals. Panel d: in and out-of transit difference centroid analysis. Within 3σ the centroids correspond to the position of the star; each centroid is color-coded by sector as in panel a.
Current usage metrics show cumulative count of Article Views (full-text article views including HTML views, PDF and ePub downloads, according to the available data) and Abstracts Views on Vision4Press platform.
Data correspond to usage on the plateform after 2015. The current usage metrics is available 48-96 hours after online publication and is updated daily on week days.
Initial download of the metrics may take a while.