Fig. A.4
Download original image
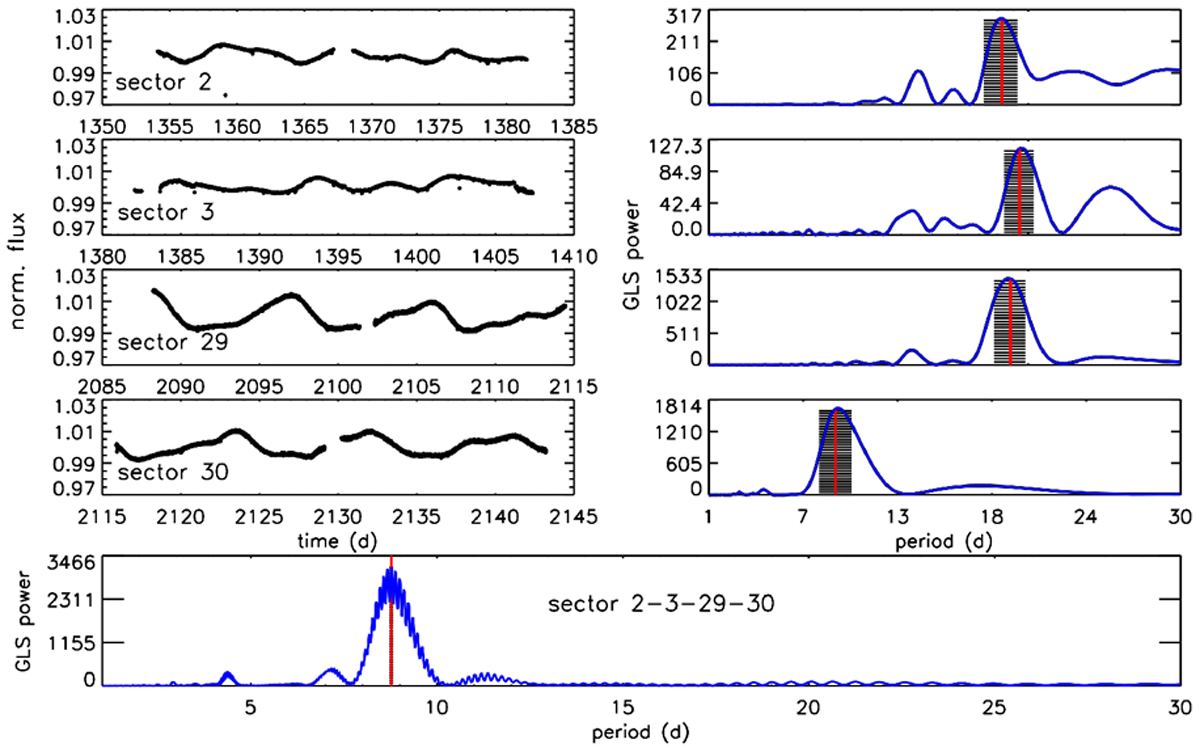
TESS light curves in Sectors 2, 3, 29, and 30 (from top to bottom) represented as normalized flux vs. time (left column), and corresponding GLS periodograms (right column) with indication of the measured periodicity (vertical red line) and its uncertainty (shaded region). Similar periodograms are obtained when using CLEAN (see Messina et al. 2022). The bottom plot shows the periodogram when all four sectors are combined into a unique time series.
Current usage metrics show cumulative count of Article Views (full-text article views including HTML views, PDF and ePub downloads, according to the available data) and Abstracts Views on Vision4Press platform.
Data correspond to usage on the plateform after 2015. The current usage metrics is available 48-96 hours after online publication and is updated daily on week days.
Initial download of the metrics may take a while.