Fig. 15
Download original image
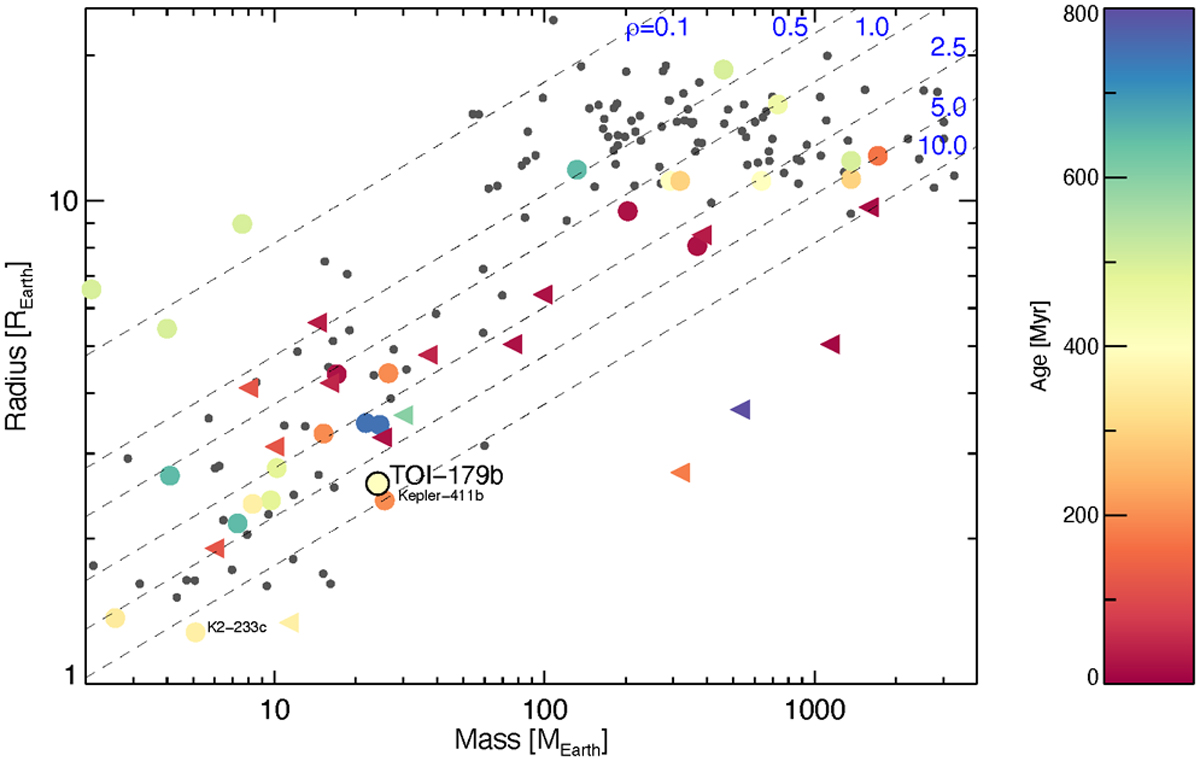
Mass-radius diagram of the well-characterized exoplanet population (gray dots) and of the young transiting planets as a function of stellar age (see color-code on the right). The colored circles indicate planets with measured, mass while triangles indicate planets with mass upper limit only. The dashed lines represent the loci of equal density (gem−3).
Current usage metrics show cumulative count of Article Views (full-text article views including HTML views, PDF and ePub downloads, according to the available data) and Abstracts Views on Vision4Press platform.
Data correspond to usage on the plateform after 2015. The current usage metrics is available 48-96 hours after online publication and is updated daily on week days.
Initial download of the metrics may take a while.