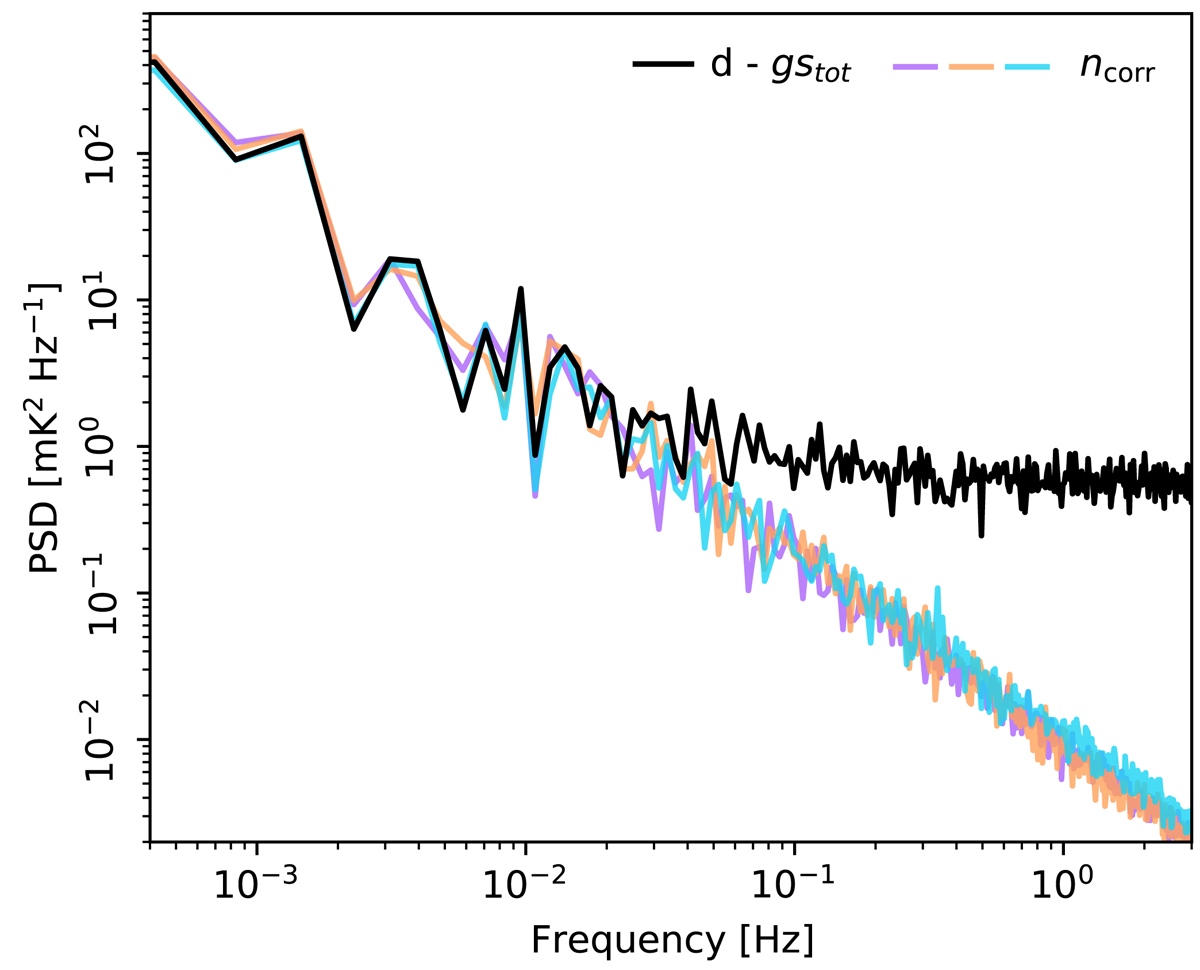
Fig. 8.
Download original image
Three subsequent samples (colored curves) of the correlated noise PSD for 23S, one of the 70 GHz radiometers. The black line shows the PSD of the signal-subtracted data.
Current usage metrics show cumulative count of Article Views (full-text article views including HTML views, PDF and ePub downloads, according to the available data) and Abstracts Views on Vision4Press platform.
Data correspond to usage on the plateform after 2015. The current usage metrics is available 48-96 hours after online publication and is updated daily on week days.
Initial download of the metrics may take a while.