Fig. 3.
Download original image
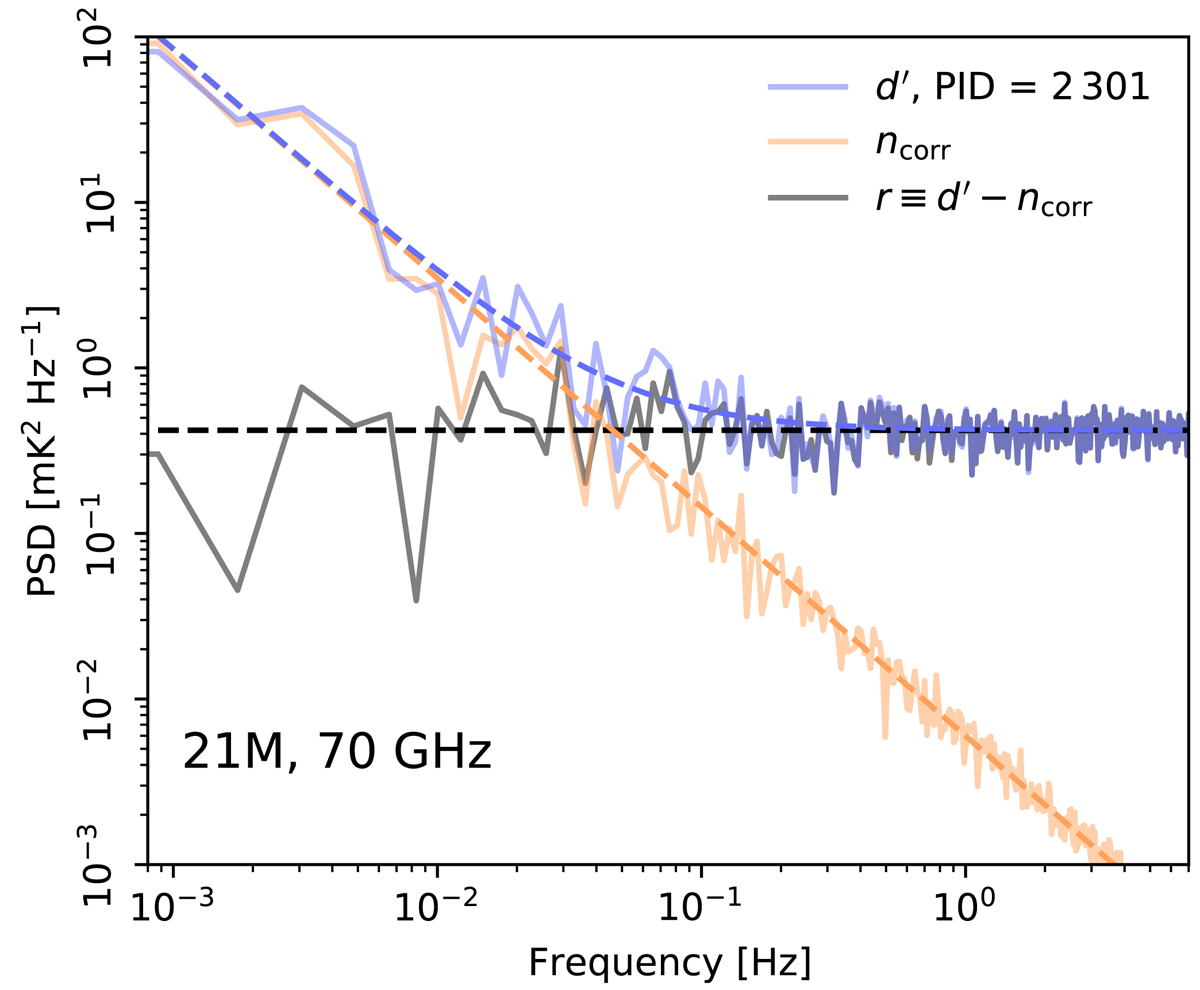
Comparison of temporal PSDs for different components. The blue curve shows the PSD of the signal-subtracted data; the orange curve shows the fitted correlated noise PSD; and the gray line shows the PSD of the residual TOD. The dashed curves correspond to the best fit 1/f-noise model, with (blue) and without (orange) white noise. Note: The 70 GHz channels do not have a lognormal component.
Current usage metrics show cumulative count of Article Views (full-text article views including HTML views, PDF and ePub downloads, according to the available data) and Abstracts Views on Vision4Press platform.
Data correspond to usage on the plateform after 2015. The current usage metrics is available 48-96 hours after online publication and is updated daily on week days.
Initial download of the metrics may take a while.