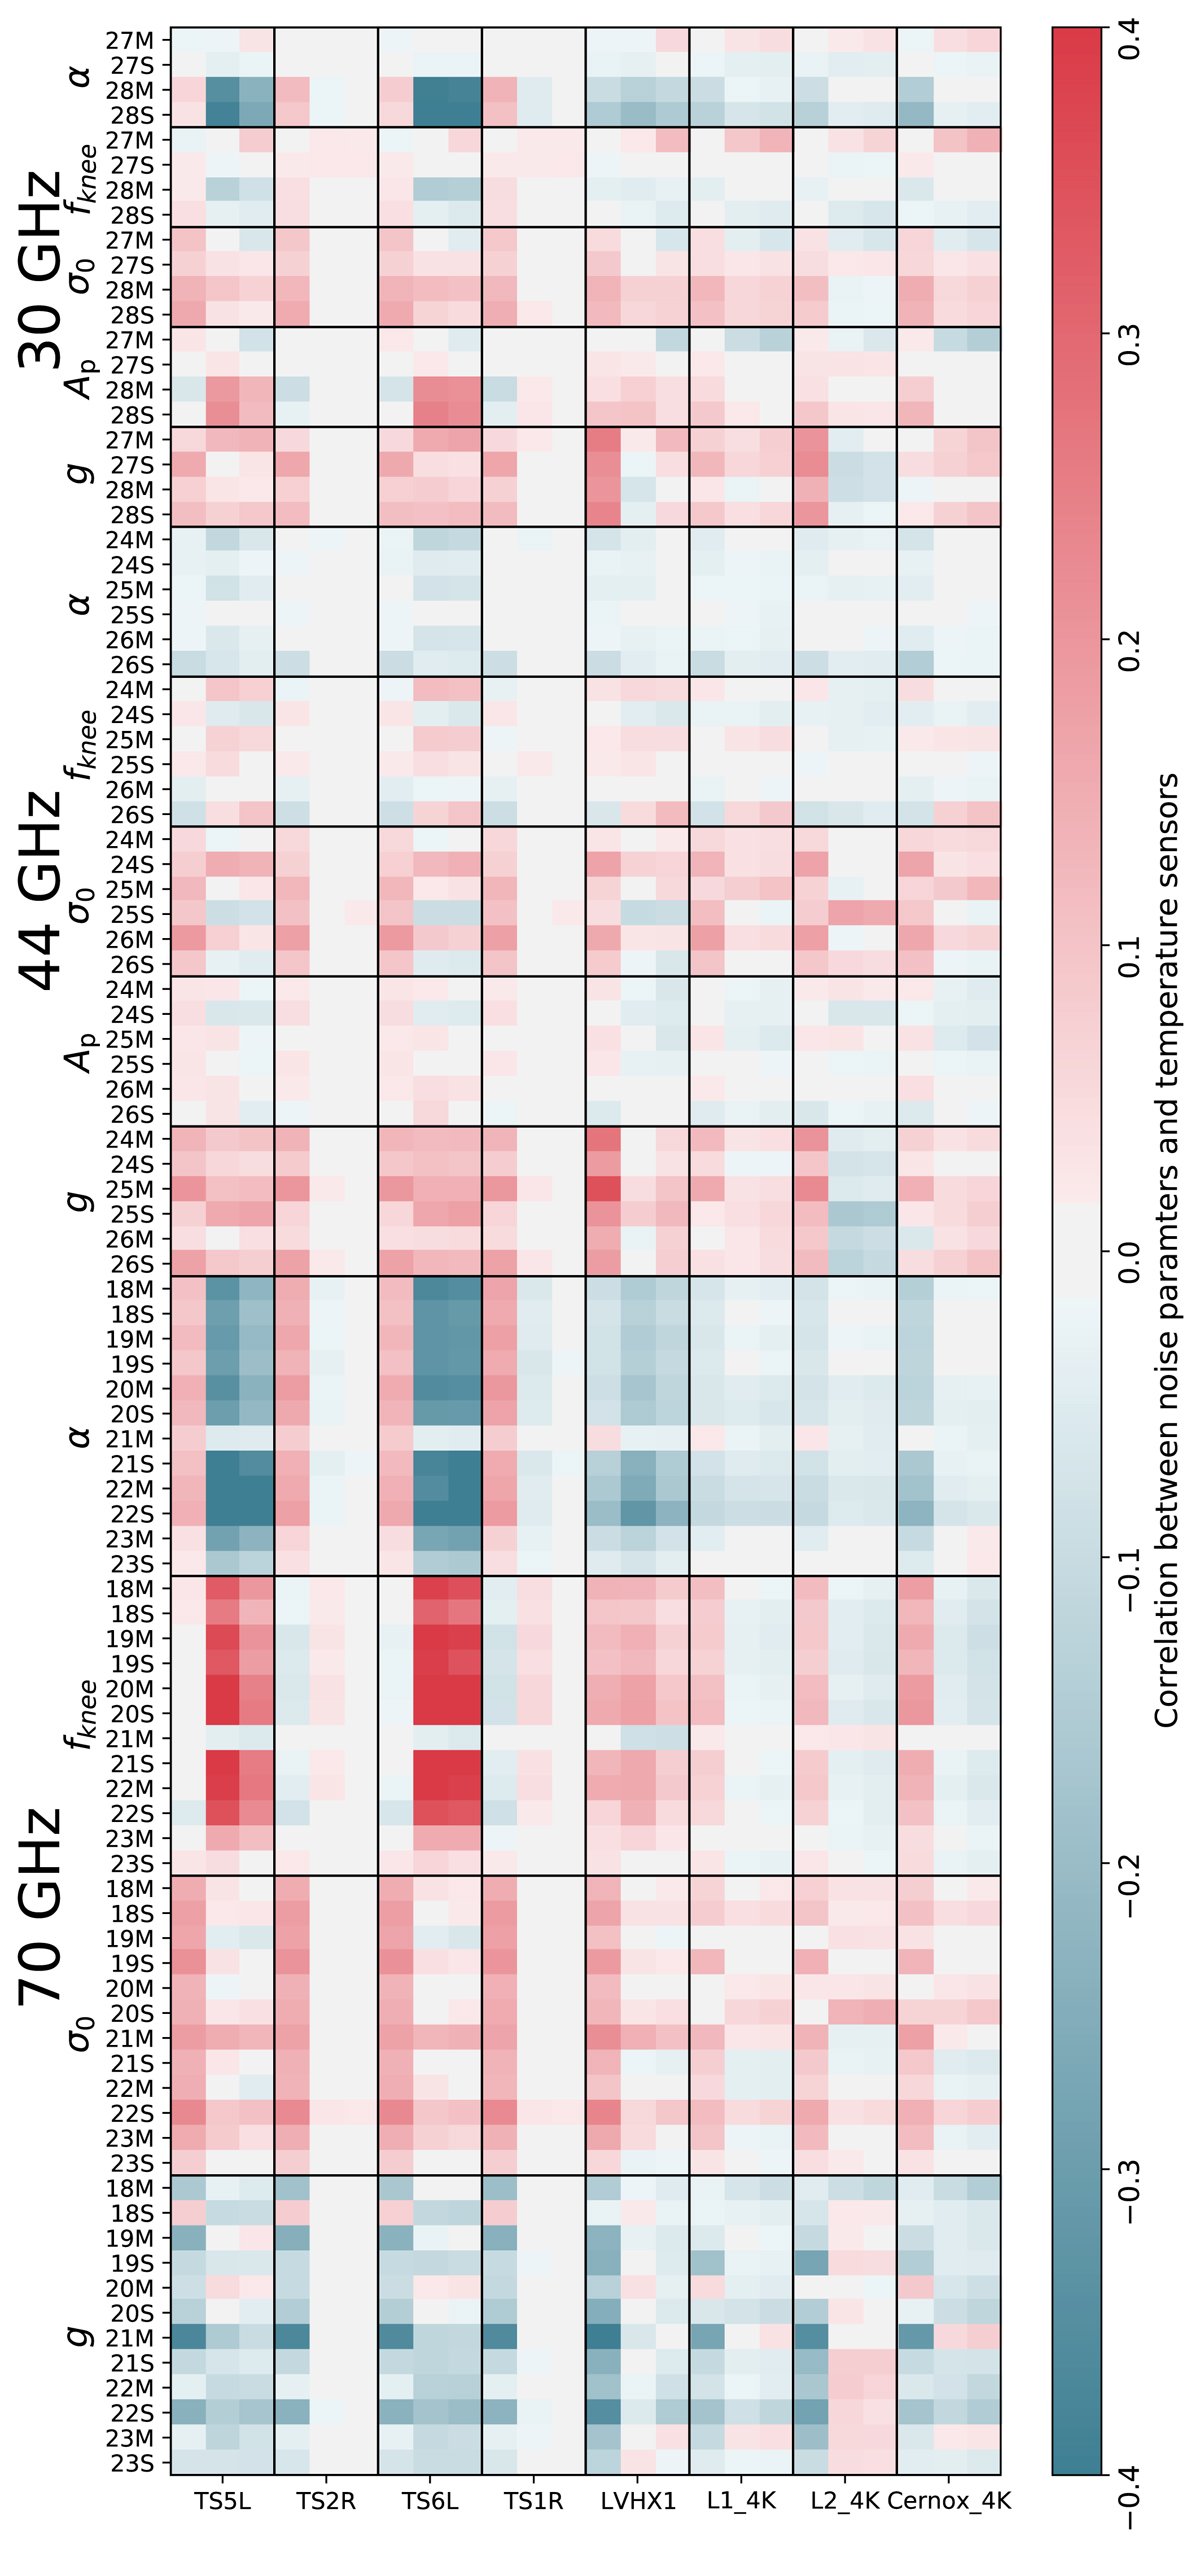
Fig. 27.
Download original image
Correlation in time, for the complete mission, between noise parameters and the temperature sensors. For each sensor we show the results (from left to right) from the mean temperature, the temperature rms, and the peak-to-peak temperature of each sensor within each pointing period. The results here are for the calibrated white noise level, σ0 [K]. We have imposed a mild high-pass filter (in time) of the different datasets in order to avoid random correlations on the very longest timescales.
Current usage metrics show cumulative count of Article Views (full-text article views including HTML views, PDF and ePub downloads, according to the available data) and Abstracts Views on Vision4Press platform.
Data correspond to usage on the plateform after 2015. The current usage metrics is available 48-96 hours after online publication and is updated daily on week days.
Initial download of the metrics may take a while.