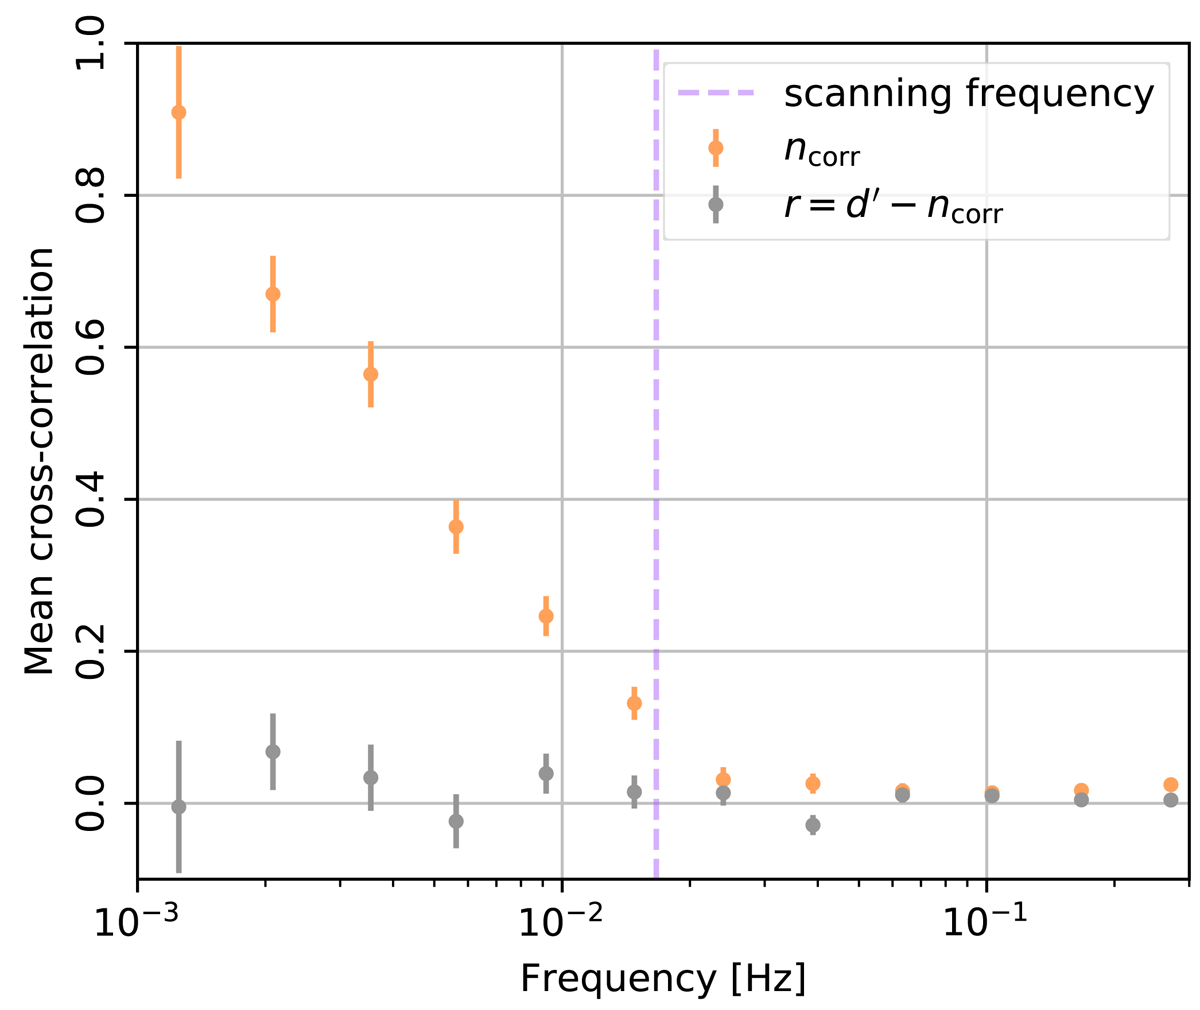
Fig. 25.

Download original image
Average cross-correlation between timestreams of all 70 GHz radiometers for PID 12301. Orange points show average correlation between the correlated noise components, while the grey points shows average correlation between the residuals. We see that even though the correlation between the correlated noise components is high, the residuals are completely uncorrelated, indicating that this correlated signal does not leak into the rest of the pipeline and, rather, it is incorporated into the correlated noise.
Current usage metrics show cumulative count of Article Views (full-text article views including HTML views, PDF and ePub downloads, according to the available data) and Abstracts Views on Vision4Press platform.
Data correspond to usage on the plateform after 2015. The current usage metrics is available 48-96 hours after online publication and is updated daily on week days.
Initial download of the metrics may take a while.


