Fig. 15.
Download original image
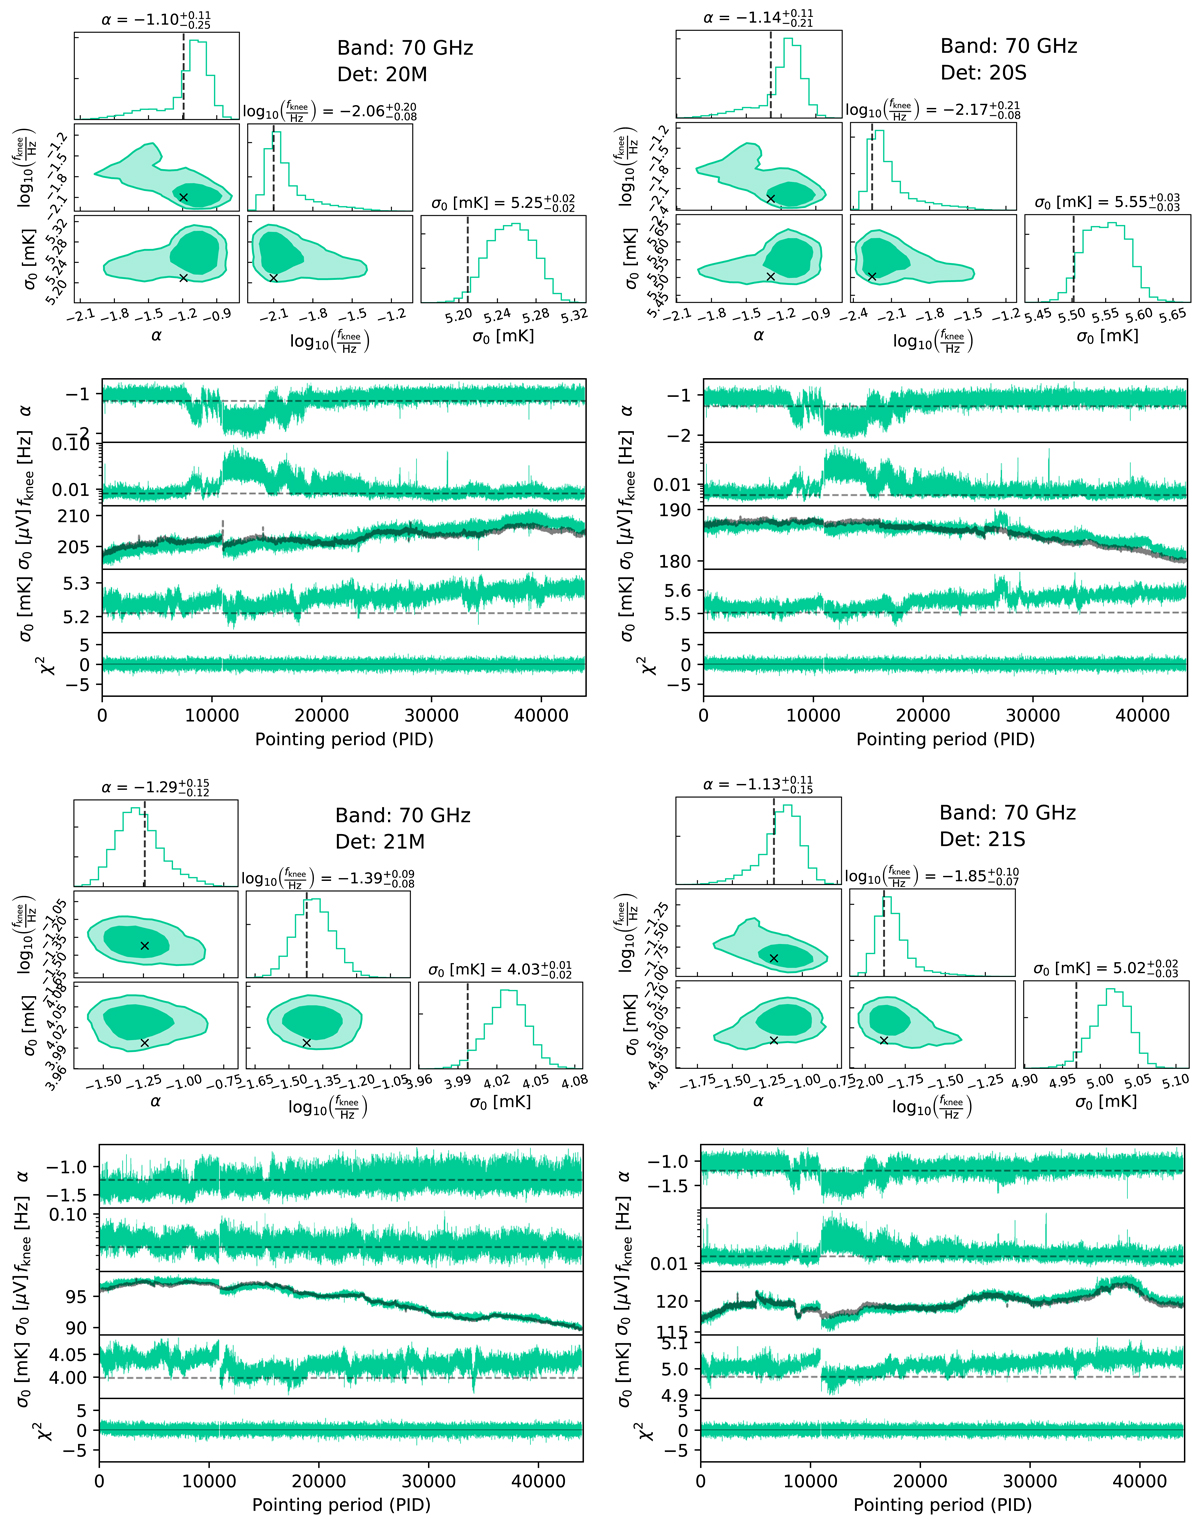
Noise characterization of the Planck LFI 70 GHz radiometers; 20M (top left), 20S (top right); 21M (bottom left), and 21S (bottom right). For each radiometer, the top figure shows distributions of noise parameters PSD, ξn = {σ0, fknee, α}, averaged over all Gibbs samples for the full mission. The bottom figure shows the time evolution of the posterior mean of the noise parameters, and the bottom panel shows the evolution in reduced normalized χ2 in units of σ. Black dashed curves and crosses show corresponding values as derived by, and used in, the official Planck LFI DPC pipeline.
Current usage metrics show cumulative count of Article Views (full-text article views including HTML views, PDF and ePub downloads, according to the available data) and Abstracts Views on Vision4Press platform.
Data correspond to usage on the plateform after 2015. The current usage metrics is available 48-96 hours after online publication and is updated daily on week days.
Initial download of the metrics may take a while.