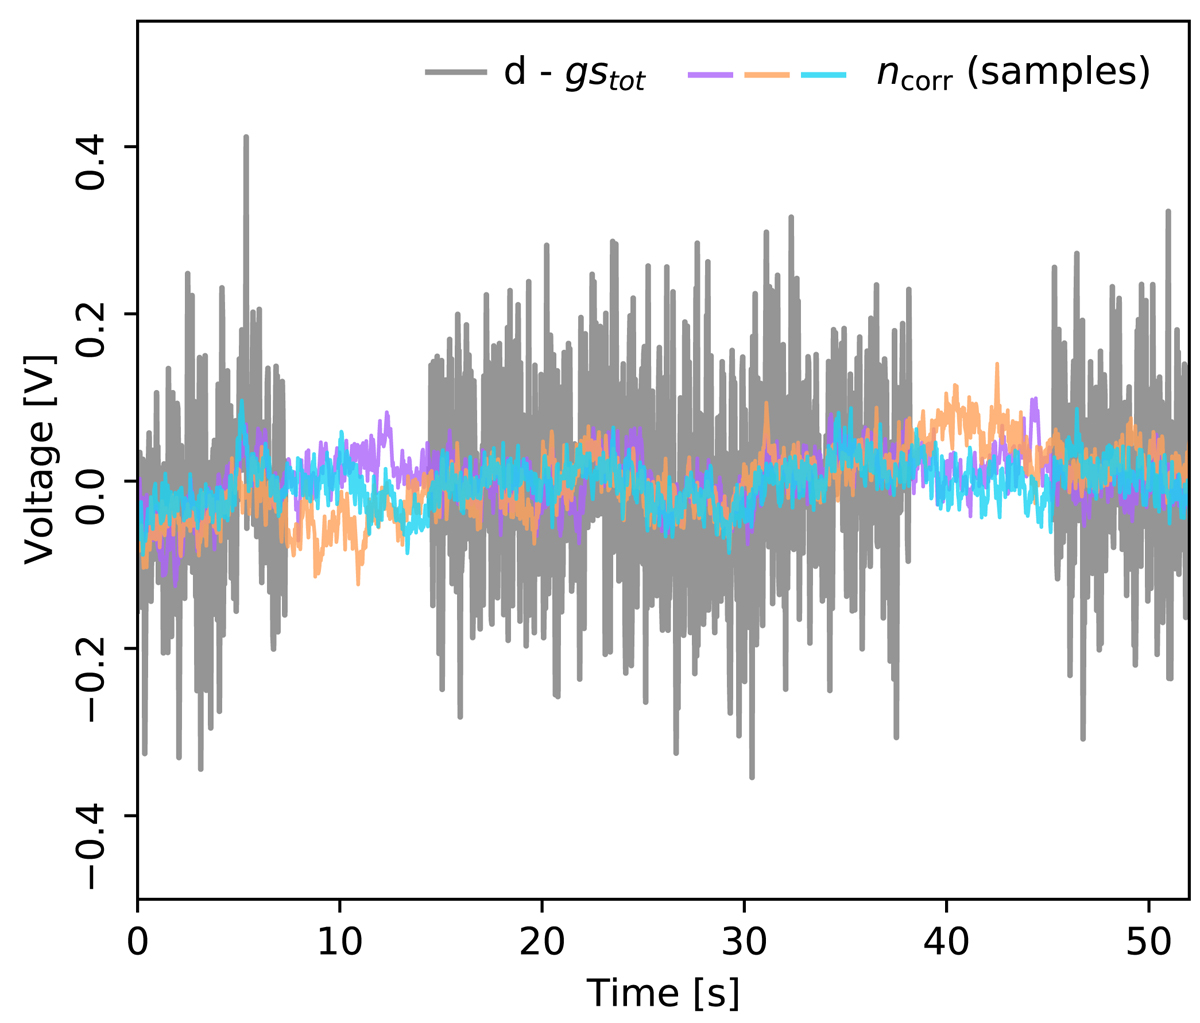
Fig. 1.
Download original image
Illustration of three constrained correlated noise realizations (colored curves) drawn from P(ncorr ∣ d, ξn, stot, g) for the Planck 30 GHz data (grey curve). Regions for which parts of the data have been masked, either due to a processing mask or flagged data, are marked as white gaps.
Current usage metrics show cumulative count of Article Views (full-text article views including HTML views, PDF and ePub downloads, according to the available data) and Abstracts Views on Vision4Press platform.
Data correspond to usage on the plateform after 2015. The current usage metrics is available 48-96 hours after online publication and is updated daily on week days.
Initial download of the metrics may take a while.