Fig. 9.
Download original image
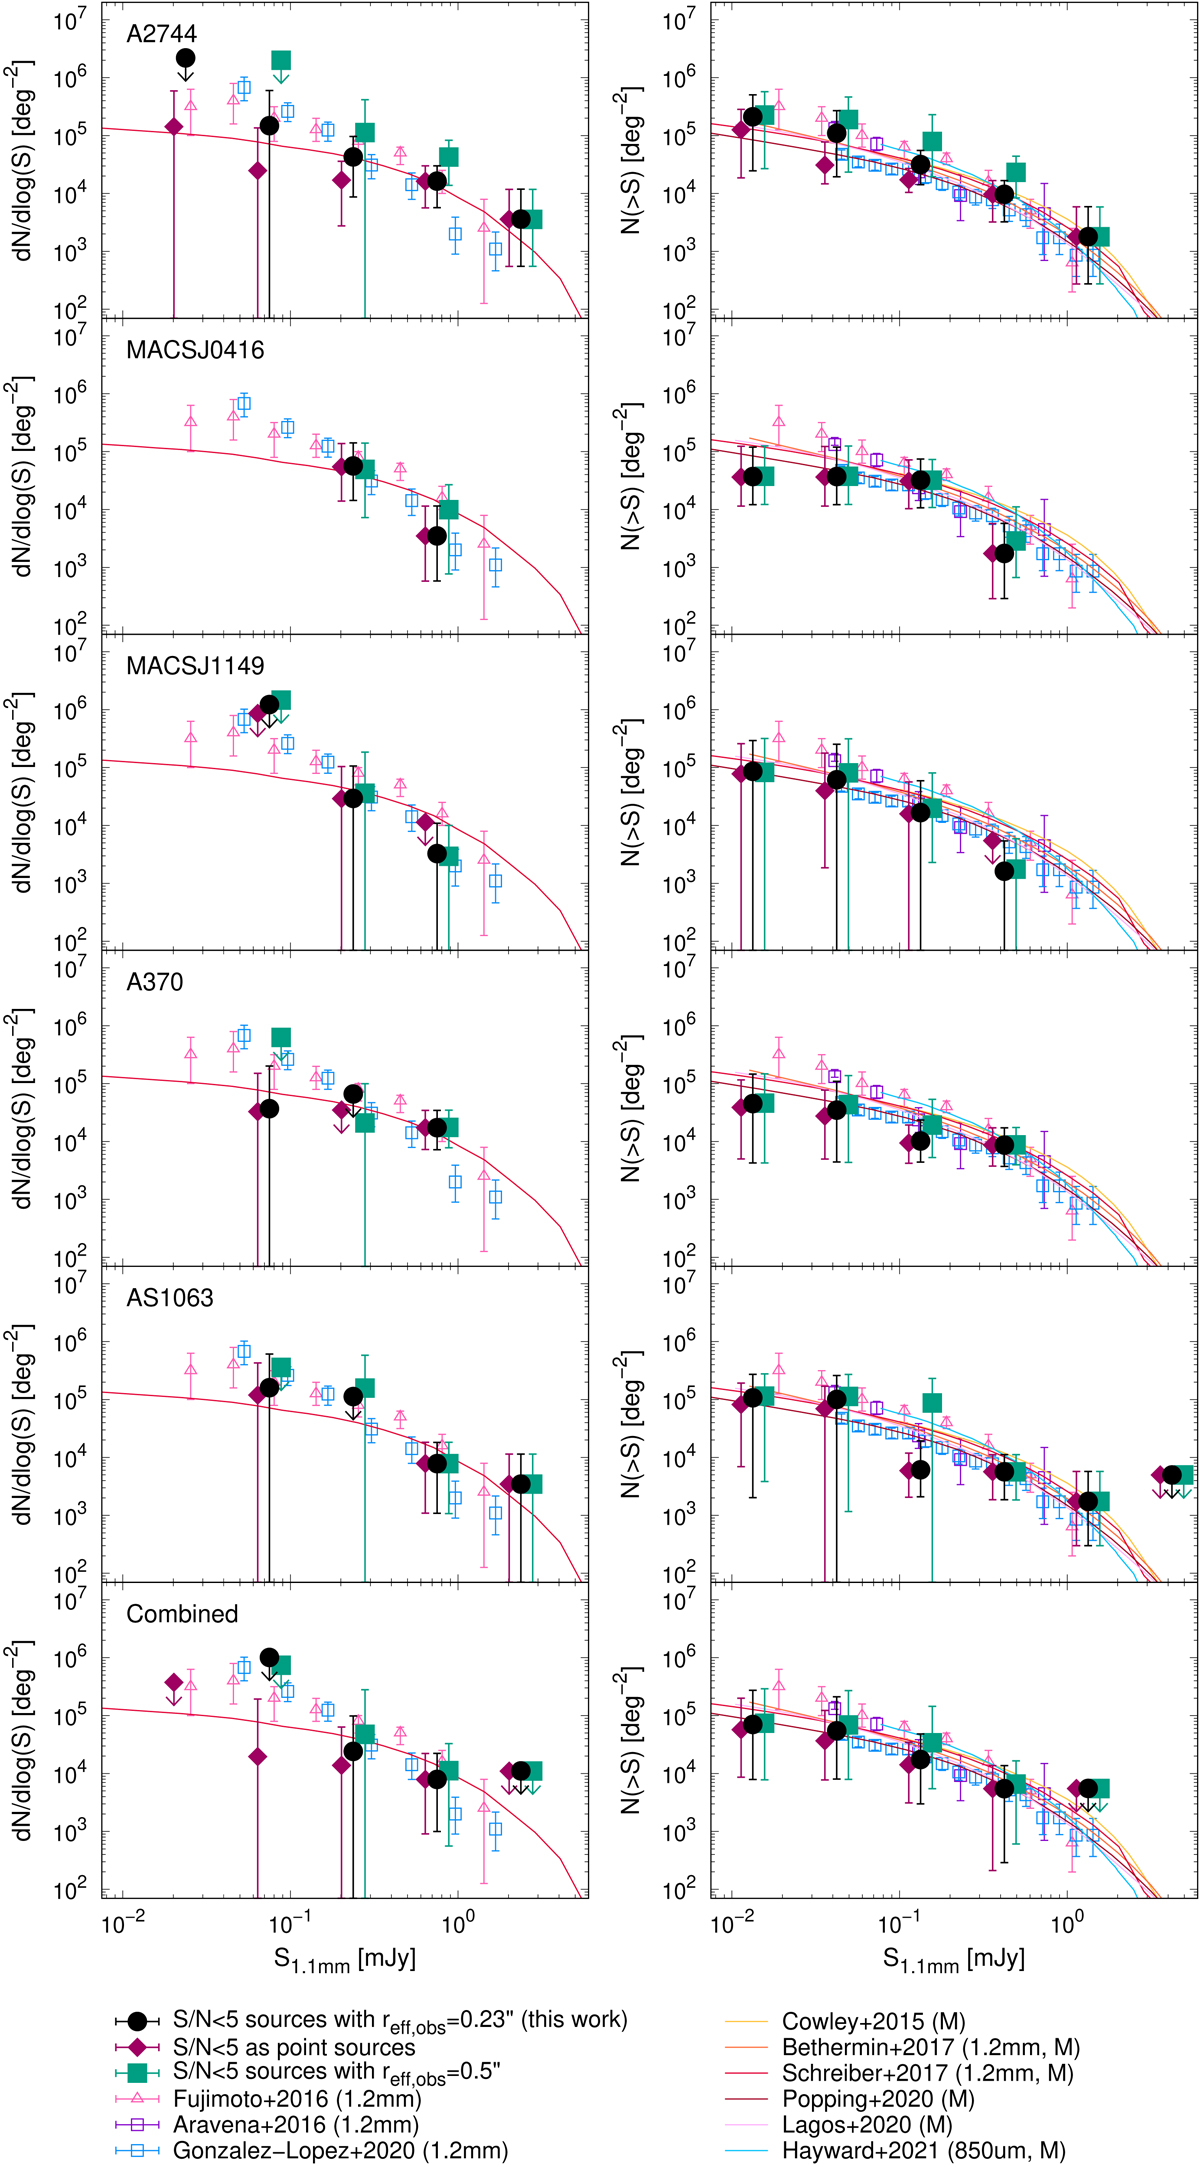
Differential (left) and cumulative (right) counts at 1.1 mm for different assumptions regarding the image-plane source scale radii (half-light radii) for low-significance sources, namely, a) adopting ![]() (black filled circles, fiducial), b) assuming they are point sources (dark magenta filled diamonds), and c) adopting
(black filled circles, fiducial), b) assuming they are point sources (dark magenta filled diamonds), and c) adopting ![]() (dark teal filled squares). Our counts correspond to median values. Error bars indicate the 16th and 84th percentiles, adding the scaled Poisson confidence levels for 1σ lower and upper limits, respectively, in quadrature. Arrows indicate 3σ upper limits for flux densities with zero median counts and nonzero values at the 84th percentile. We show previous results reported by Fujimoto et al. (2016) as magenta triangles, Aravena et al. (2016) as purple squares, and González-López et al. (2020) as blue squares. We show number counts predicted by the galaxy evolution models from Cowley et al. (2015) (yellow line), Béthermin et al. (2017) (orange line), Schreiber et al. (2017) (red line), Popping et al. (2020) (dark red line), Lagos et al. (2020) (light magenta line), and Hayward et al. (2021) (light blue line). We scale the counts derived at other wavelengths as in Fig. 8.
(dark teal filled squares). Our counts correspond to median values. Error bars indicate the 16th and 84th percentiles, adding the scaled Poisson confidence levels for 1σ lower and upper limits, respectively, in quadrature. Arrows indicate 3σ upper limits for flux densities with zero median counts and nonzero values at the 84th percentile. We show previous results reported by Fujimoto et al. (2016) as magenta triangles, Aravena et al. (2016) as purple squares, and González-López et al. (2020) as blue squares. We show number counts predicted by the galaxy evolution models from Cowley et al. (2015) (yellow line), Béthermin et al. (2017) (orange line), Schreiber et al. (2017) (red line), Popping et al. (2020) (dark red line), Lagos et al. (2020) (light magenta line), and Hayward et al. (2021) (light blue line). We scale the counts derived at other wavelengths as in Fig. 8.
Current usage metrics show cumulative count of Article Views (full-text article views including HTML views, PDF and ePub downloads, according to the available data) and Abstracts Views on Vision4Press platform.
Data correspond to usage on the plateform after 2015. The current usage metrics is available 48-96 hours after online publication and is updated daily on week days.
Initial download of the metrics may take a while.