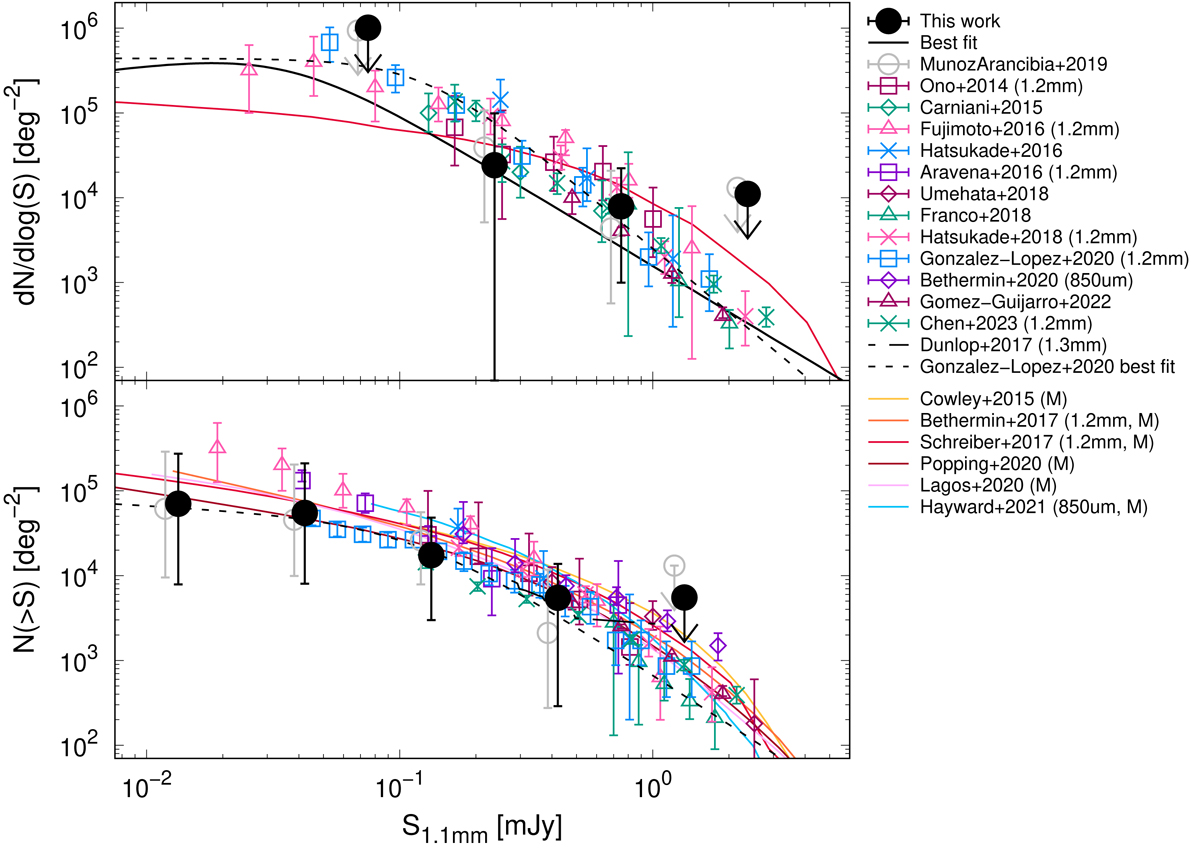
Fig. 8.
Download original image
Differential (top) and cumulative (bottom) counts at 1.1 mm compared to ALMA results and galaxy evolution model predictions from the literature. Our counts (large, black, filled circles) correspond to median values combining all models for all cluster fields. Error bars indicate the 16th and 84th percentiles, adding the scaled Poisson confidence levels for 1σ lower and upper limits, respectively, in quadrature. Arrows indicate 3σ upper limits for flux densities with zero median counts and nonzero values at the 84th percentile. We show our best double power-law fit as a black solid line (see Sect. 4.5). We display the counts we derived for the first three FF clusters using PB > 0.5 (Muñoz Arancibia et al. 2019, Paper IV Corrigendum) as large, gray, open circles. We show previous results reported by Ono et al. (2014) as dark magenta squares, Carniani et al. (2015) as dark teal diamonds, Fujimoto et al. (2016) as magenta triangles, Hatsukade et al. (2016) as blue crosses, Aravena et al. (2016) as purple squares, Umehata et al. (2018) as dark magenta diamonds, Franco et al. (2018) as dark teal triangles, Hatsukade et al. (2018) as magenta crosses, González-López et al. (2020) as blue squares (with their best fit from a P(D) analysis shown as a black dashed line), Béthermin et al. (2020) as purple diamonds, Gómez-Guijarro et al. (2022) as dark magenta triangles, Chen et al. (2023) as dark teal crosses, and Dunlop et al. (2017) as a black, dot-dashed curve. We show number counts predicted by the galaxy evolution models from Cowley et al. (2015) (yellow line), Béthermin et al. (2017) (orange line), Schreiber et al. (2017) (red line), Popping et al. (2020) (dark red line), Lagos et al. (2020) (light magenta line), and Hayward et al. (2021) (light blue line). We scale the counts derived at other wavelengths as S1.1 mm = 1.59 × S1.3 mm, S1.1 mm = 1.27 × S1.2 mm, and S1.1 mm = 0.51 × S850 μm, assuming a modified black body (see Sect. 4.3).
Current usage metrics show cumulative count of Article Views (full-text article views including HTML views, PDF and ePub downloads, according to the available data) and Abstracts Views on Vision4Press platform.
Data correspond to usage on the plateform after 2015. The current usage metrics is available 48-96 hours after online publication and is updated daily on week days.
Initial download of the metrics may take a while.