Fig. A.1.
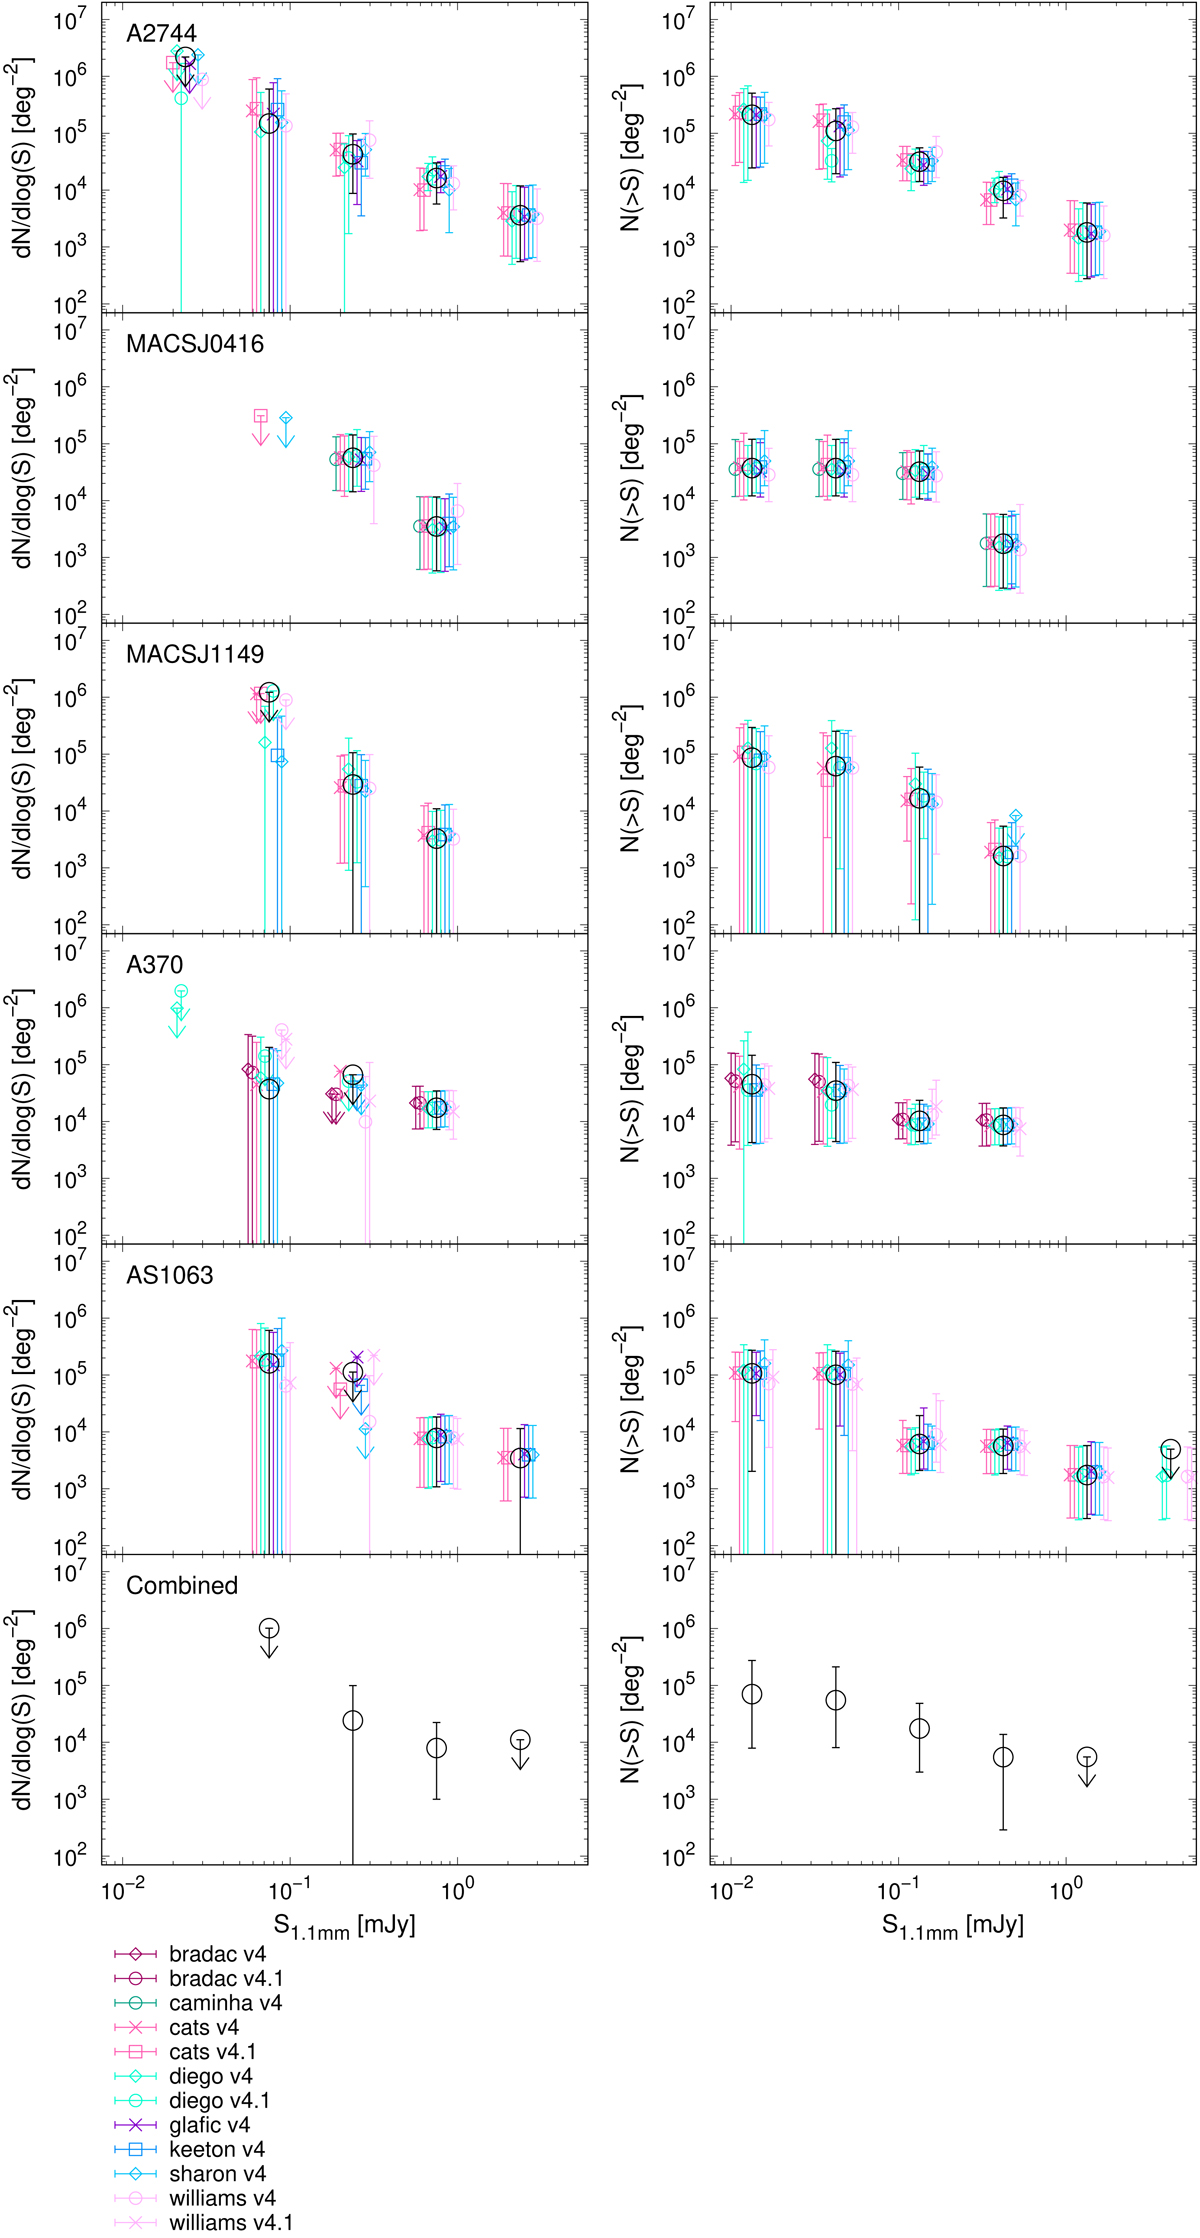
Download original image
Differential (left) and cumulative (right) counts at 1.1 mm (large black circles) for each cluster (see legends in the top left) and combining all cluster fields (bottom panel). In the first five panels, we also show counts for each lens model (colored symbols) offset in flux around the combined counts for clarity. All values correspond to median counts. Error bars indicate the 16th and 84th percentiles, adding the scaled Poisson confidence levels for 1σ lower and upper limits, respectively, in quadrature. Arrows indicate 3σ upper limits for flux densities having zero median counts and nonzero values at the 84th percentile.
Current usage metrics show cumulative count of Article Views (full-text article views including HTML views, PDF and ePub downloads, according to the available data) and Abstracts Views on Vision4Press platform.
Data correspond to usage on the plateform after 2015. The current usage metrics is available 48-96 hours after online publication and is updated daily on week days.
Initial download of the metrics may take a while.