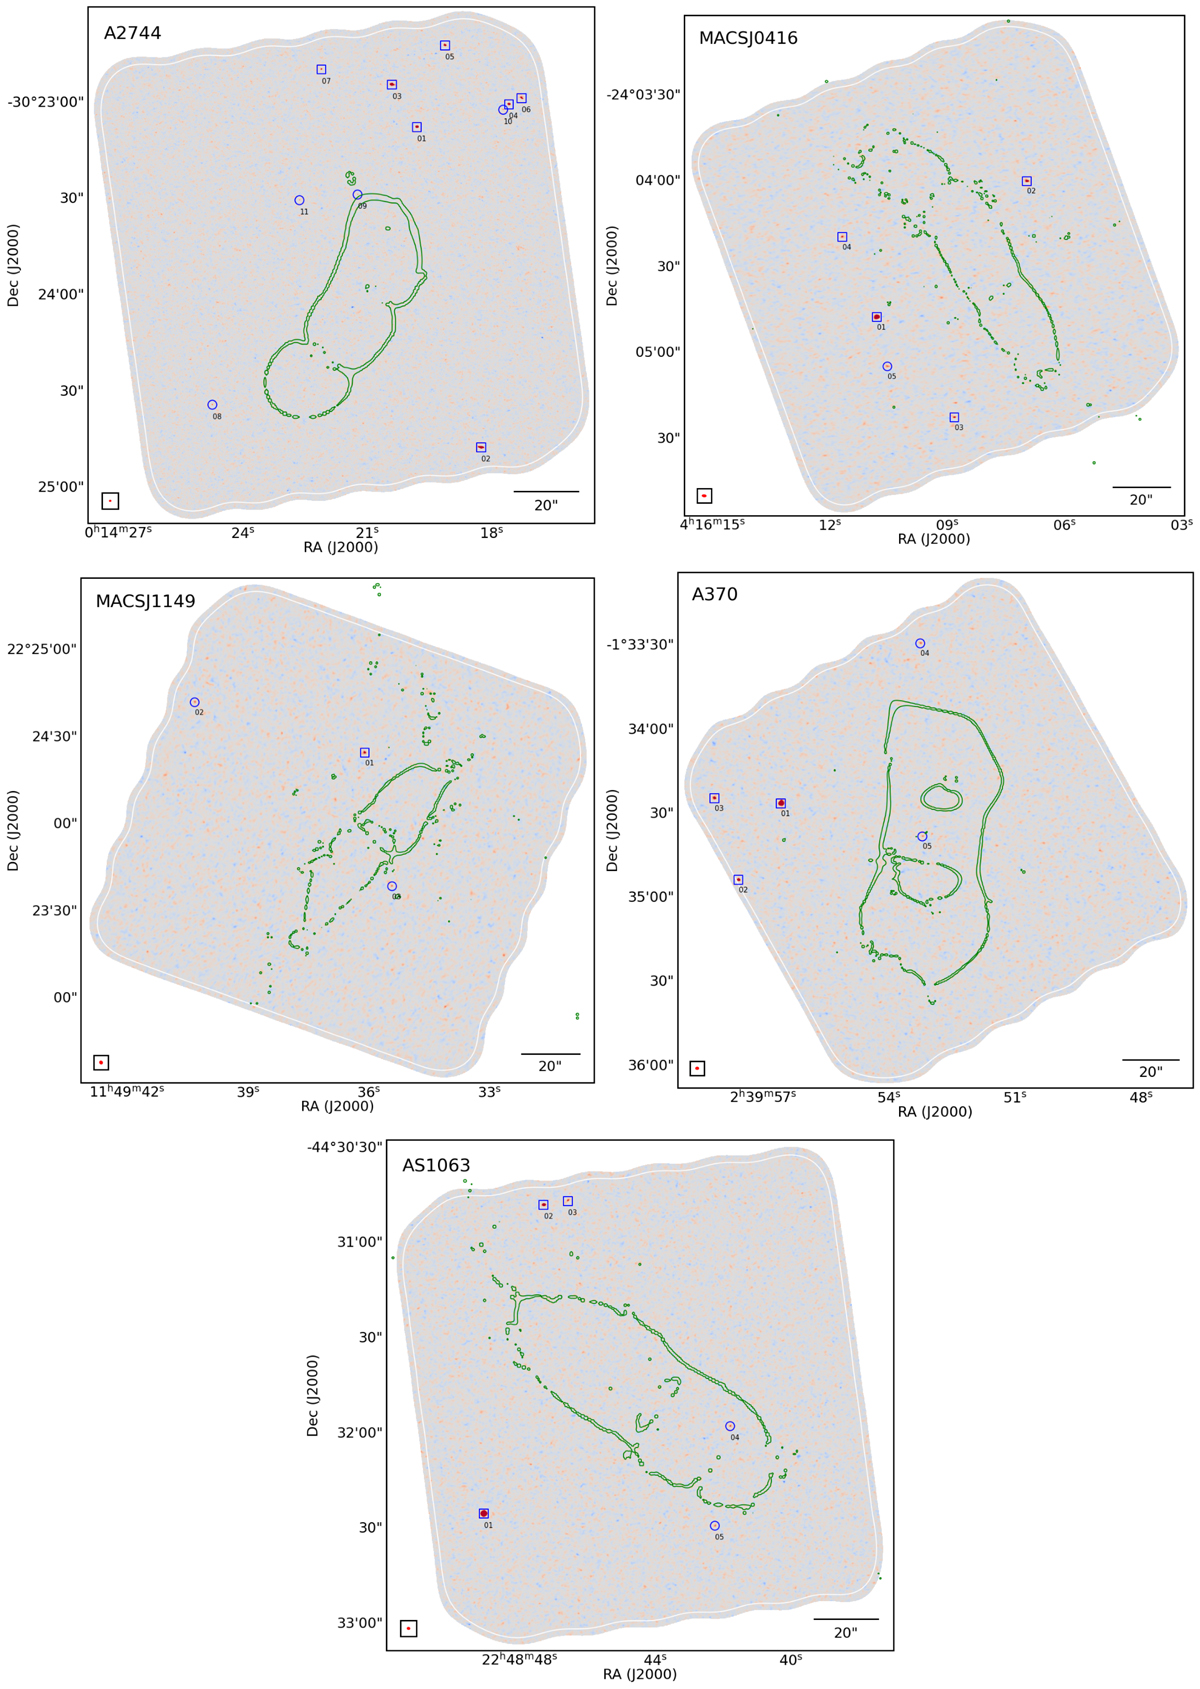
Fig. 1.

Download original image
ALMA continuum maps at 1.1 mm for five FF clusters, made with natural weighting. Images are displayed without PB sensitivity corrections. Color scale goes from blue to red, corresponding to −5σ to 5σ. A white contour in each map encloses the region with PB > 0.3, that is, where the PB sensitivity is at least 30% of the peak sensitivity. Source positions are displayed in blue as squares (high significance) or circles (low significance). A small box in the bottom left corner of each panel shows the synthesized beam (see parameters in Table 1). Green lines indicate the critical curves (i.e., infinite magnification) for a z = 2 source plane in the Diego v4.1 lens model (see references in Table 3).
Current usage metrics show cumulative count of Article Views (full-text article views including HTML views, PDF and ePub downloads, according to the available data) and Abstracts Views on Vision4Press platform.
Data correspond to usage on the plateform after 2015. The current usage metrics is available 48-96 hours after online publication and is updated daily on week days.
Initial download of the metrics may take a while.


