Fig. 7.
Download original image
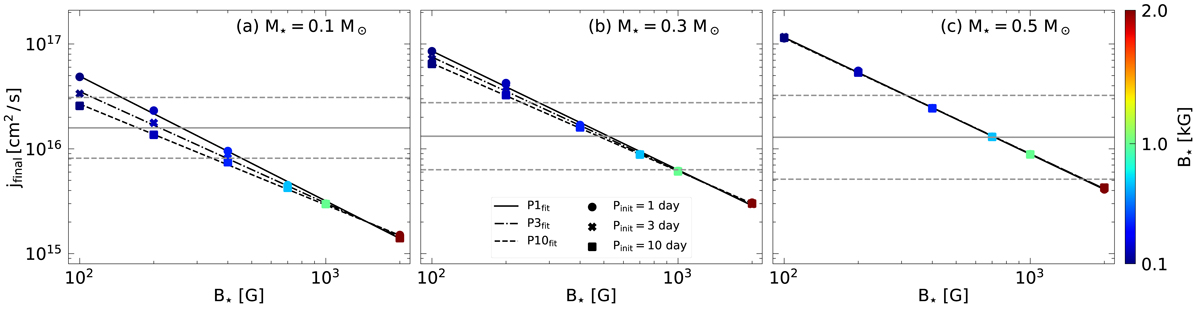
The SAM after the disk phase jfinal for different stellar magnetic field values and stellar masses of 0.1 M⊙ (panel a), 0.3 M⊙ (panel b), and 0.5 M⊙ (panel c). The colored circles, crosses, and squares represent initial rotation periods of 1, 3, and 10 days, respectively, and the solid, dash-dotted, and dashed lines show the respective fits. Mean and standard deviation values for the SAM taken from Somers et al. (2017) are represented by gray solid and dashed lines, respectively.
Current usage metrics show cumulative count of Article Views (full-text article views including HTML views, PDF and ePub downloads, according to the available data) and Abstracts Views on Vision4Press platform.
Data correspond to usage on the plateform after 2015. The current usage metrics is available 48-96 hours after online publication and is updated daily on week days.
Initial download of the metrics may take a while.