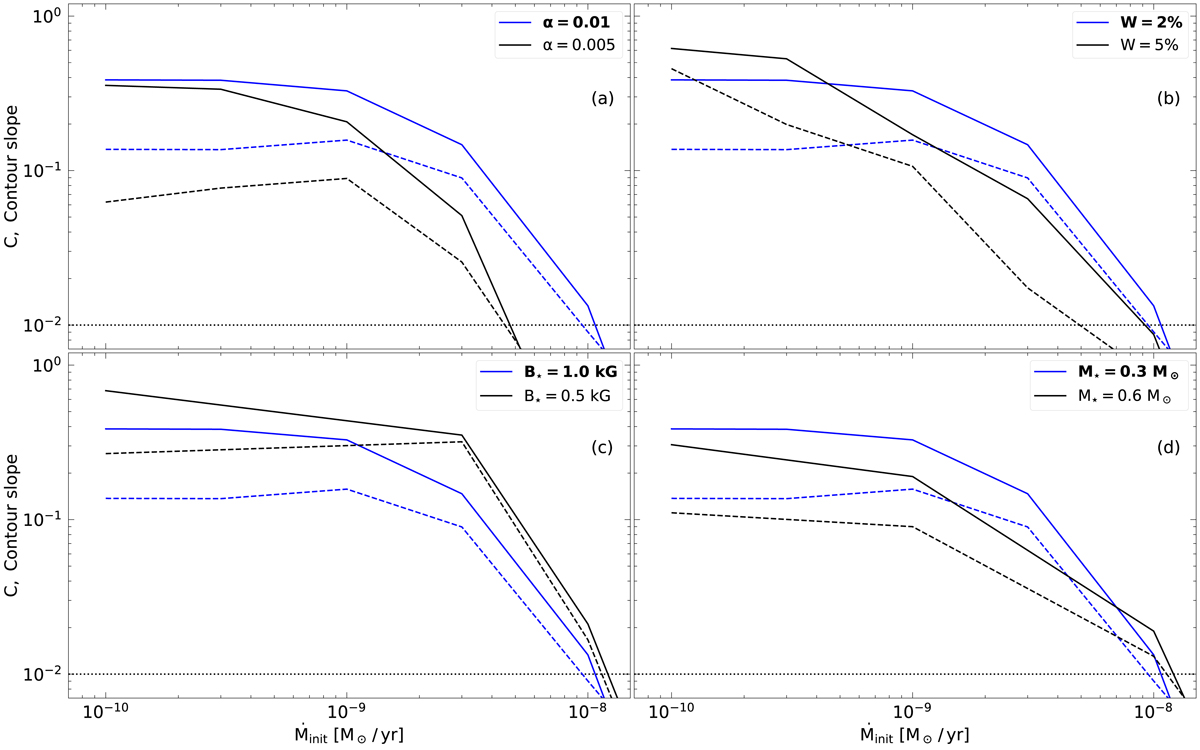
Fig. 6.
Download original image
C-parameter (the gradient of the contours in Fig. 5) with respect to initial disk accretion rates Ṁinit. The solid lines represent CP and the dashed lines Cj values, respectively. Each subplot shows variations in (a) viscous α parameter: 0.01 (blue lines) and 0.005 (black lines). The stellar mass is 0.3 M⊙ with a magnetic dipole field strength of B⋆ = 1 kG. (b) W values: 2% (blue lines) and 5% (black lines). The stellar mass is 0.3 M⊙ with a magnetic dipole field strength of B⋆ = 1 kG and a viscosity parameter of α = 0.01. (c) B⋆ values: 1.0 kG (blue lines) and 0.5 kG (black lines). The stellar mass is 0.3 M⊙ with a viscosity parameter of α = 0.01. (d) M⋆ values: 0.3 M⊙ (blue lines) and 0.6 M⊙ (black lines). The viscosity parameter is α = 0.01. The threshold of C = 0.01 for the star to be in the “locked”-state is indicated by the horizontal dotted line. For better visualization, the highlighted parameters show the reference value in the other subplots.
Current usage metrics show cumulative count of Article Views (full-text article views including HTML views, PDF and ePub downloads, according to the available data) and Abstracts Views on Vision4Press platform.
Data correspond to usage on the plateform after 2015. The current usage metrics is available 48-96 hours after online publication and is updated daily on week days.
Initial download of the metrics may take a while.