Fig. 10.
Download original image
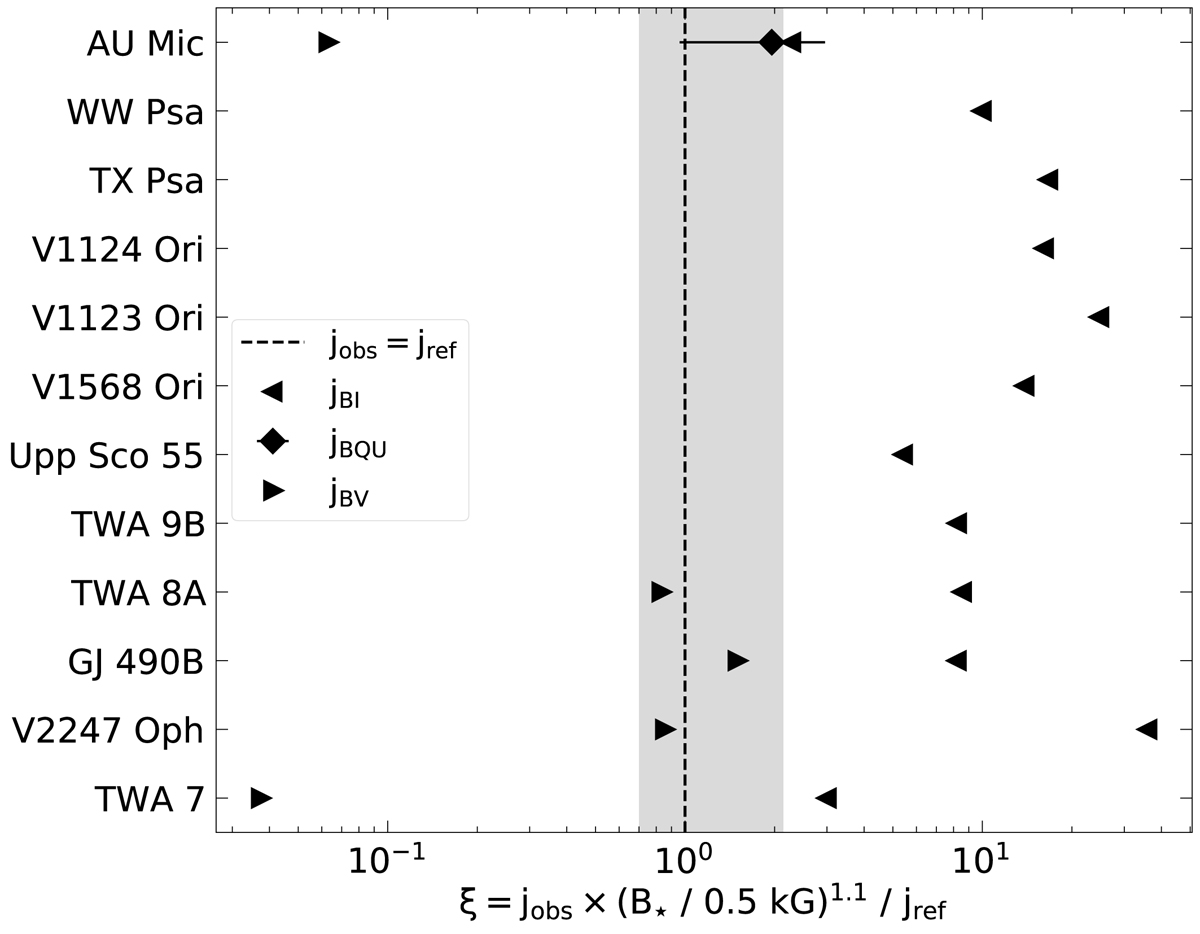
Ratio of the observed to predicted SAM jobs/jfinal. To facilitate the comparison, jobs is multiplied by a factor of (B⋆/0.5 kG)1.1 (see text). The vertical dashed line indicates a perfect agreement between the observed value and our model jref(M⋆). The gray area accounts for different stellar and disk parameters. The SAM values jBI and jBV are based on BI and BV functions as the upper and lower boundary for the stellar SAM. They are indicated by left and right-facing triangles, respectively. The single measured value (and uncertainties) of jBQU (diamond marker) is based on BQU for the star AU Mic. The measurements are tabulated in Table C.1.
Current usage metrics show cumulative count of Article Views (full-text article views including HTML views, PDF and ePub downloads, according to the available data) and Abstracts Views on Vision4Press platform.
Data correspond to usage on the plateform after 2015. The current usage metrics is available 48-96 hours after online publication and is updated daily on week days.
Initial download of the metrics may take a while.