Fig. 4.
Download original image
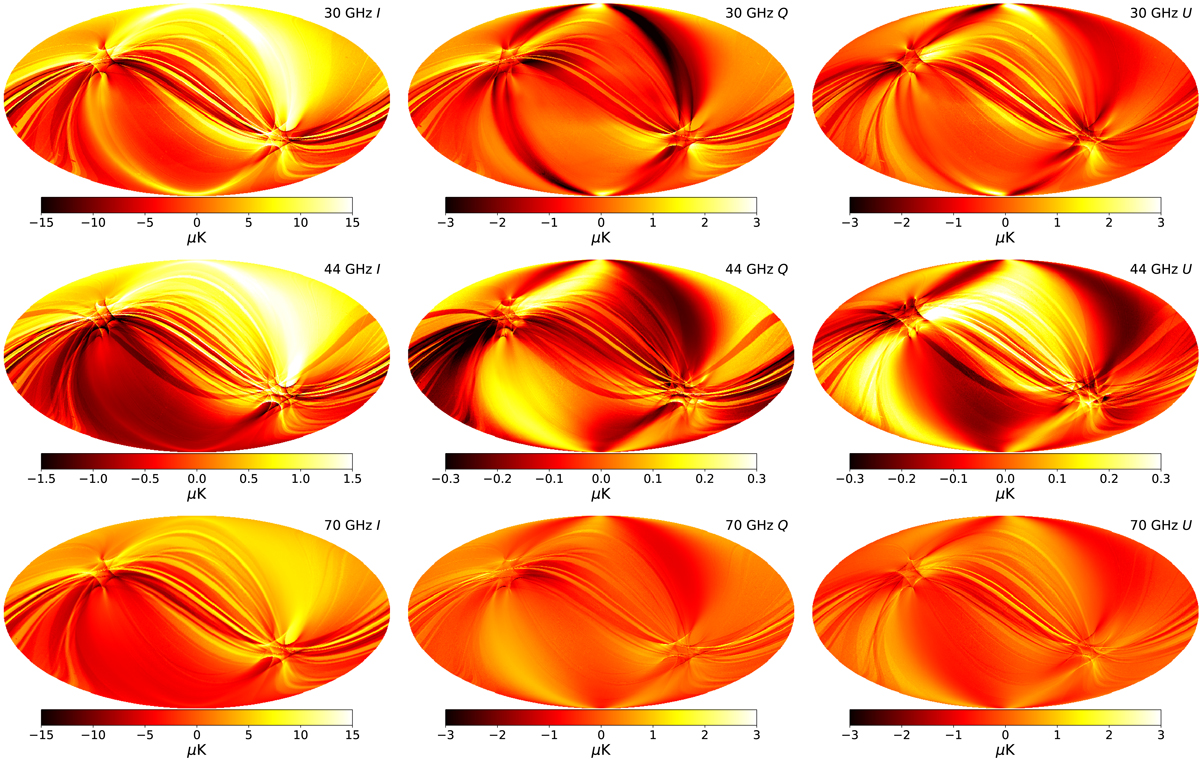
Maps of the sidelobes convolved with the sky at each of the three LFI frequencies. From top to bottom: 30 GHz, 44 GHz and 70 GHz. Left column: unpolarized sky signal, central column: Q polarization and right column: U. Note the difference in the colour scales required to see the same level of detail in all three channels.
Current usage metrics show cumulative count of Article Views (full-text article views including HTML views, PDF and ePub downloads, according to the available data) and Abstracts Views on Vision4Press platform.
Data correspond to usage on the plateform after 2015. The current usage metrics is available 48-96 hours after online publication and is updated daily on week days.
Initial download of the metrics may take a while.