Fig. 3.
Download original image
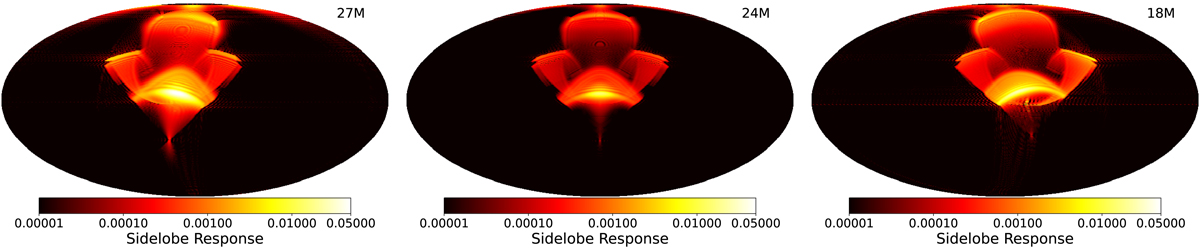
Maps of the sidelobe response on the sky from a representative detector at (left to right) 30 GHz, 44 GHz, and 70 GHz. The beam orientation is such that the main beam is pointed directly at the north pole in these maps. The intensities are normalized such that the main beams have unit power at l = 0.
Current usage metrics show cumulative count of Article Views (full-text article views including HTML views, PDF and ePub downloads, according to the available data) and Abstracts Views on Vision4Press platform.
Data correspond to usage on the plateform after 2015. The current usage metrics is available 48-96 hours after online publication and is updated daily on week days.
Initial download of the metrics may take a while.