Fig. 4.
Download original image
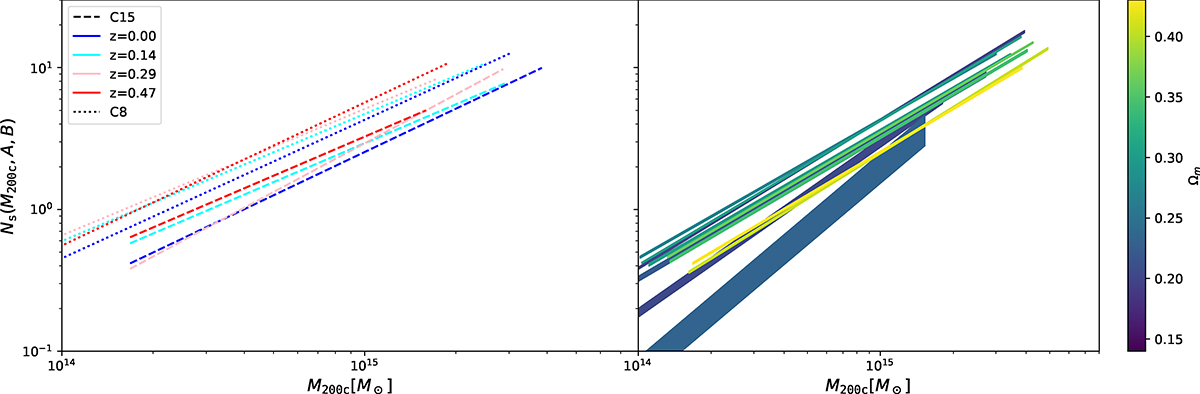
Average satellite count within R200c vs. halo mass for different simulations and redshifts as resulting from maximising the likelihood in Eq. (5). Left panel: satellite count vs. halo mass relation for simulations Box1a/mr C8 (dashed lines) and C15(dotted lines) at three different redshifts (the redder the higher the redshift). Right panel: each line represents a simulation at z = 0, colour coded with green with increasing Ωm; line thickness covers the Gaussian scatter (Poissonian scatter is omitted).
Current usage metrics show cumulative count of Article Views (full-text article views including HTML views, PDF and ePub downloads, according to the available data) and Abstracts Views on Vision4Press platform.
Data correspond to usage on the plateform after 2015. The current usage metrics is available 48-96 hours after online publication and is updated daily on week days.
Initial download of the metrics may take a while.