Fig. 2.
Download original image
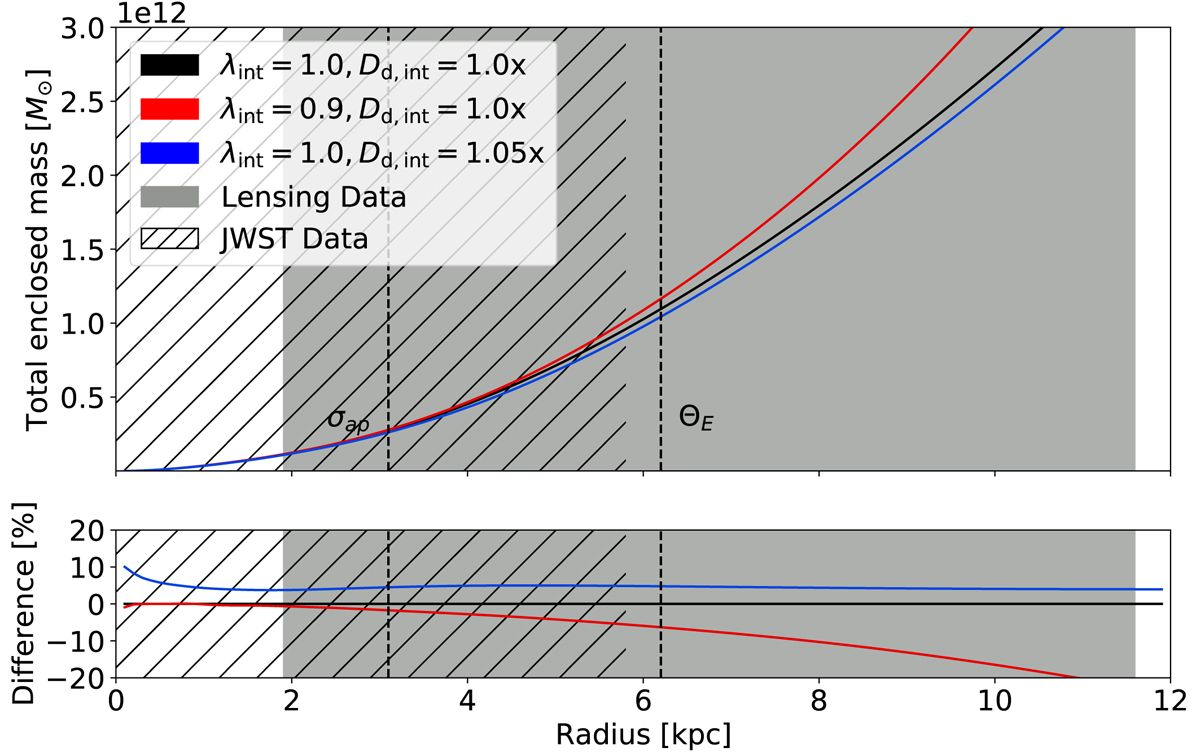
Total enclosed mass profile in 3D and its sensitivity to λint and Dd, int. Top: Total enclosed mass profile in 3D as a function of intrinsic radius (![]() ), after deprojecting the SMD in Eqs. (14) and (15) into an oblate axisymmetric system. The black line shows the mock input mass profile (i.e. the COMPOSITE model without a mass sheet), and the red line shows the mass-sheet-transformed profile with λint = 0.9. The profile without a MST, but with Dd, int scaled by +5%, is shown in blue. All profiles have been obtained by expanding the SMD by multiple Gaussians (MGE), where the number of Gaussians is optimised during the fitting process. The final fit usually consists of 30–50 Gaussians for each mass model. Especially in the presence of a mass sheet, more Gaussians are needed to fit the extended low-SMD wings. The vertical dashed lines indicate the extent of literature, aperture-averaged measurement of the velocity dispersion (σap) and the Einstein radius (θE) in projection. The grey shaded area shows the region where the lensed imaging data constrain the mass model, and the striped area roughly corresponds to JWST’s FOV, shown in Fig. 1. Bottom: Percent differences in the total enclosed mass as a function of radius when compared to the mock input mass profile (black), where the difference is between the black curve and the respective coloured line in the top panel. The figure illustrates that a single-aperture-averaged velocity dispersion is insufficient for constraining the mass sheet, given the minuscule differences in the total enclosed mass within that radius and errors on the kinematics of the order of 5%. On the other hand, spatially resolved kinematics are sensitive to both differences in the enclosed mass and the mass slope. As is evident from the figure, Dd, int and λint are not degenerate. That is, changes in λint (and hence DΔt, int) cannot be compensated for by a corresponding scaling of the lens distance, Dd, int. Numerical noise from the MGE is present, but its contribution to the observed differences is subdominant with respect to the final modelling uncertainties.
), after deprojecting the SMD in Eqs. (14) and (15) into an oblate axisymmetric system. The black line shows the mock input mass profile (i.e. the COMPOSITE model without a mass sheet), and the red line shows the mass-sheet-transformed profile with λint = 0.9. The profile without a MST, but with Dd, int scaled by +5%, is shown in blue. All profiles have been obtained by expanding the SMD by multiple Gaussians (MGE), where the number of Gaussians is optimised during the fitting process. The final fit usually consists of 30–50 Gaussians for each mass model. Especially in the presence of a mass sheet, more Gaussians are needed to fit the extended low-SMD wings. The vertical dashed lines indicate the extent of literature, aperture-averaged measurement of the velocity dispersion (σap) and the Einstein radius (θE) in projection. The grey shaded area shows the region where the lensed imaging data constrain the mass model, and the striped area roughly corresponds to JWST’s FOV, shown in Fig. 1. Bottom: Percent differences in the total enclosed mass as a function of radius when compared to the mock input mass profile (black), where the difference is between the black curve and the respective coloured line in the top panel. The figure illustrates that a single-aperture-averaged velocity dispersion is insufficient for constraining the mass sheet, given the minuscule differences in the total enclosed mass within that radius and errors on the kinematics of the order of 5%. On the other hand, spatially resolved kinematics are sensitive to both differences in the enclosed mass and the mass slope. As is evident from the figure, Dd, int and λint are not degenerate. That is, changes in λint (and hence DΔt, int) cannot be compensated for by a corresponding scaling of the lens distance, Dd, int. Numerical noise from the MGE is present, but its contribution to the observed differences is subdominant with respect to the final modelling uncertainties.
Current usage metrics show cumulative count of Article Views (full-text article views including HTML views, PDF and ePub downloads, according to the available data) and Abstracts Views on Vision4Press platform.
Data correspond to usage on the plateform after 2015. The current usage metrics is available 48-96 hours after online publication and is updated daily on week days.
Initial download of the metrics may take a while.