Fig. 7
Download original image
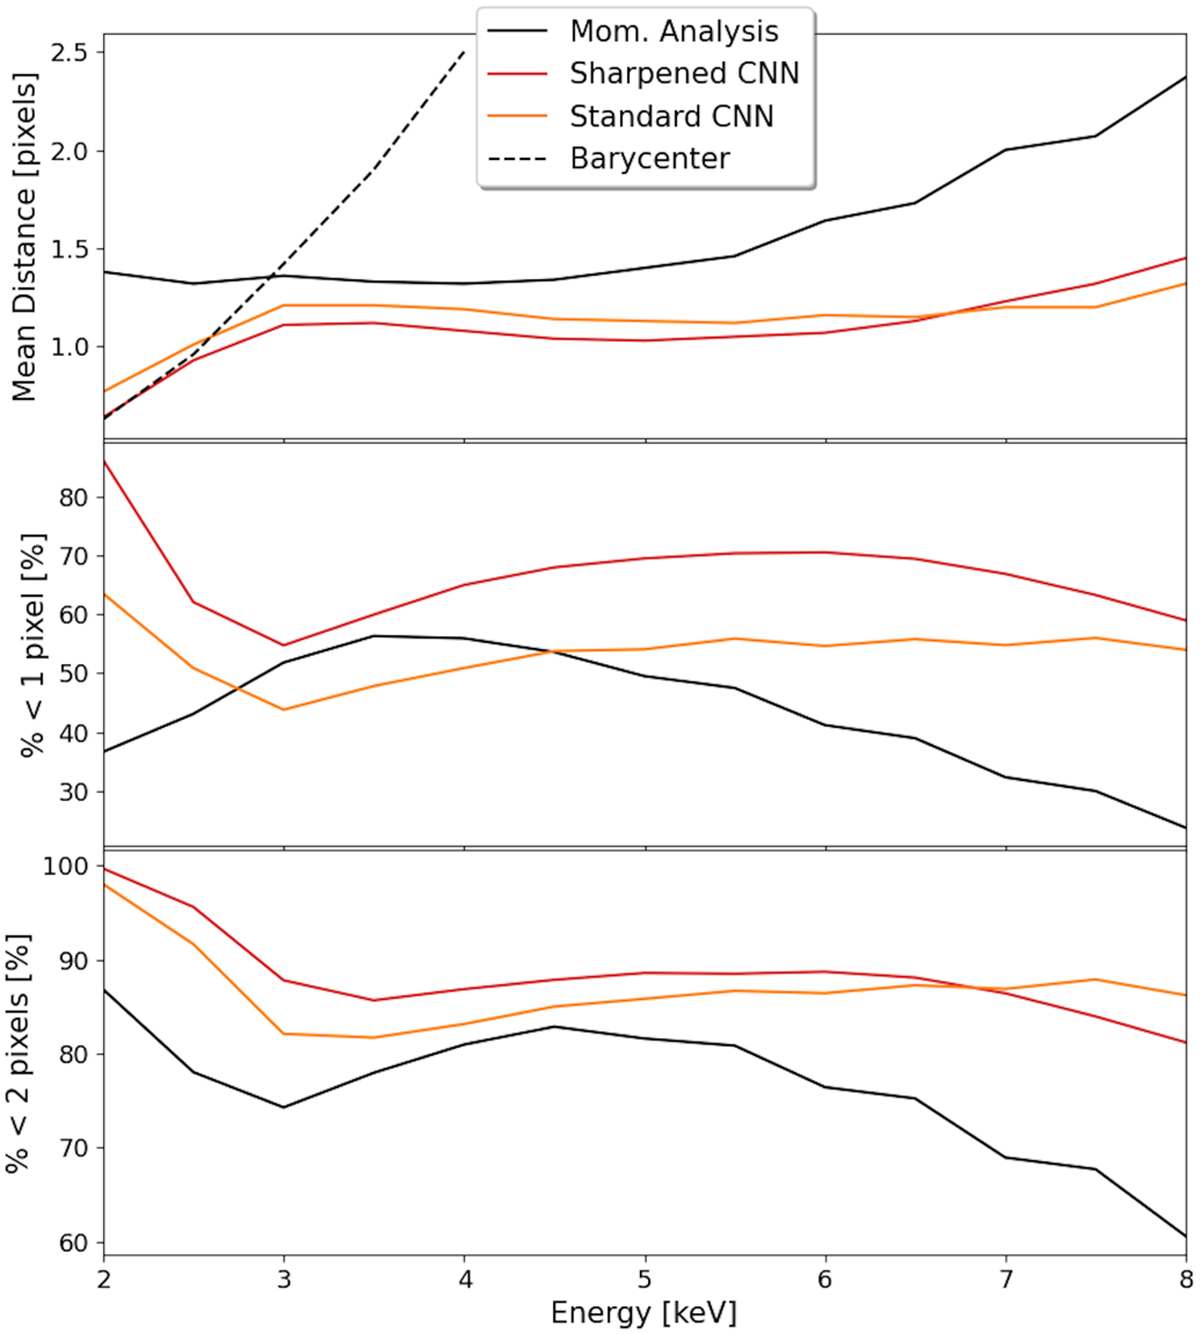
Comparison of the IP position reconstruction between our sharpened-image CNN (red line), an unsharpened-image CNN (orange line), and the moment analysis (black line). In the top panel, the mean distance between the true IP position and the predicted one is reported. The dashed black line represents the distance between the true IP and the barycenter of the track. In the middle and bottom panel we reported the percentage of events for which the distance between the true and the predicted IP position is lower than one and two pixels, respectively.
Current usage metrics show cumulative count of Article Views (full-text article views including HTML views, PDF and ePub downloads, according to the available data) and Abstracts Views on Vision4Press platform.
Data correspond to usage on the plateform after 2015. The current usage metrics is available 48-96 hours after online publication and is updated daily on week days.
Initial download of the metrics may take a while.