Fig. 4
Download original image
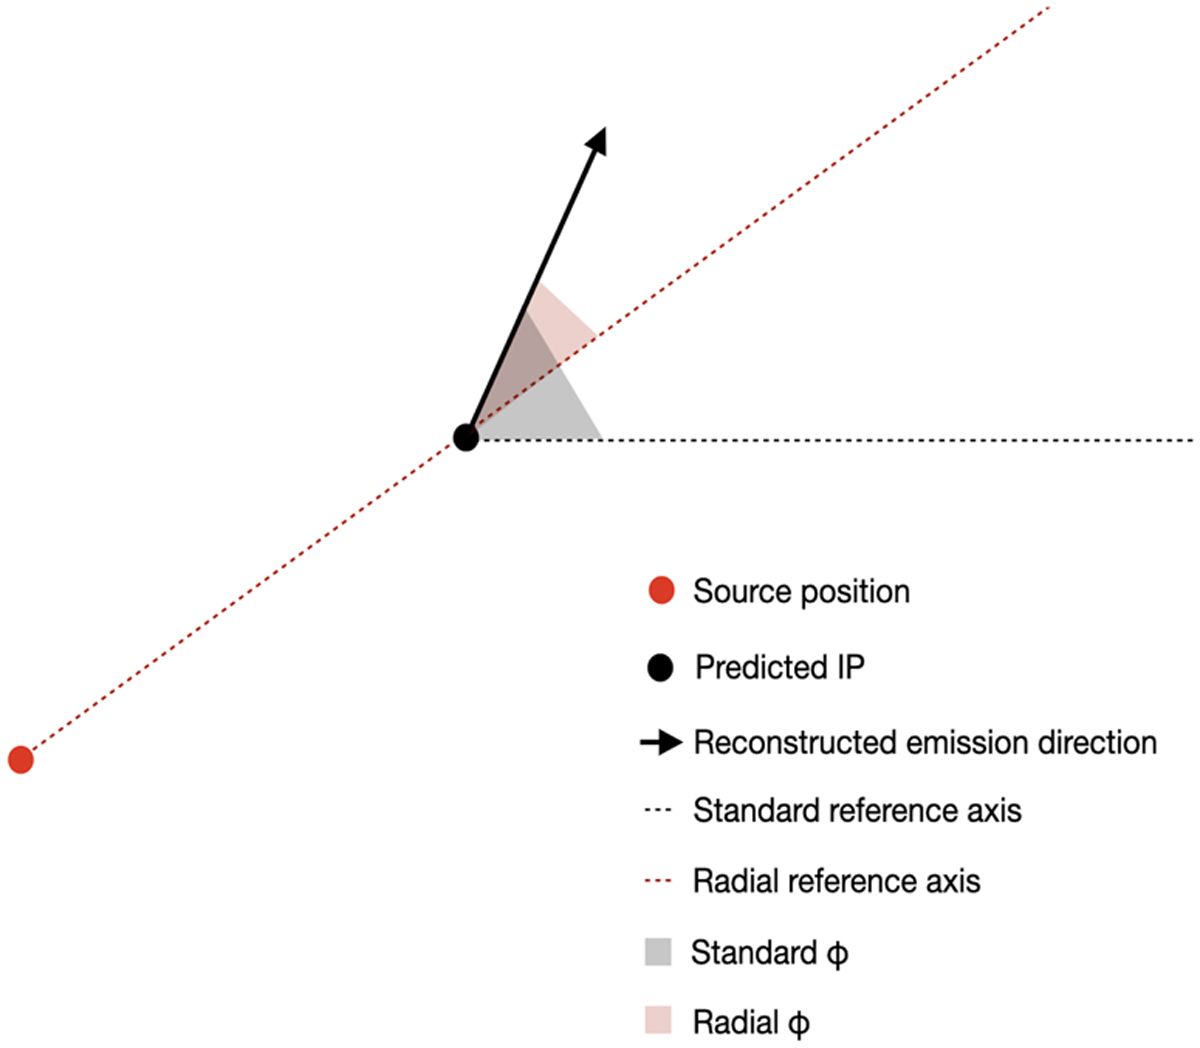
Representation of the radial alignment for a single event. The red and black dots are the source and the predicted IP positions, respectively. The black arrow is the predicted emission direction. The dashed red and black lines are the radial and standard reference axes, respectively, while the red and black angles are the radial and standard predicted emission angles, respectively.
Current usage metrics show cumulative count of Article Views (full-text article views including HTML views, PDF and ePub downloads, according to the available data) and Abstracts Views on Vision4Press platform.
Data correspond to usage on the plateform after 2015. The current usage metrics is available 48-96 hours after online publication and is updated daily on week days.
Initial download of the metrics may take a while.