Fig. 2
Download original image
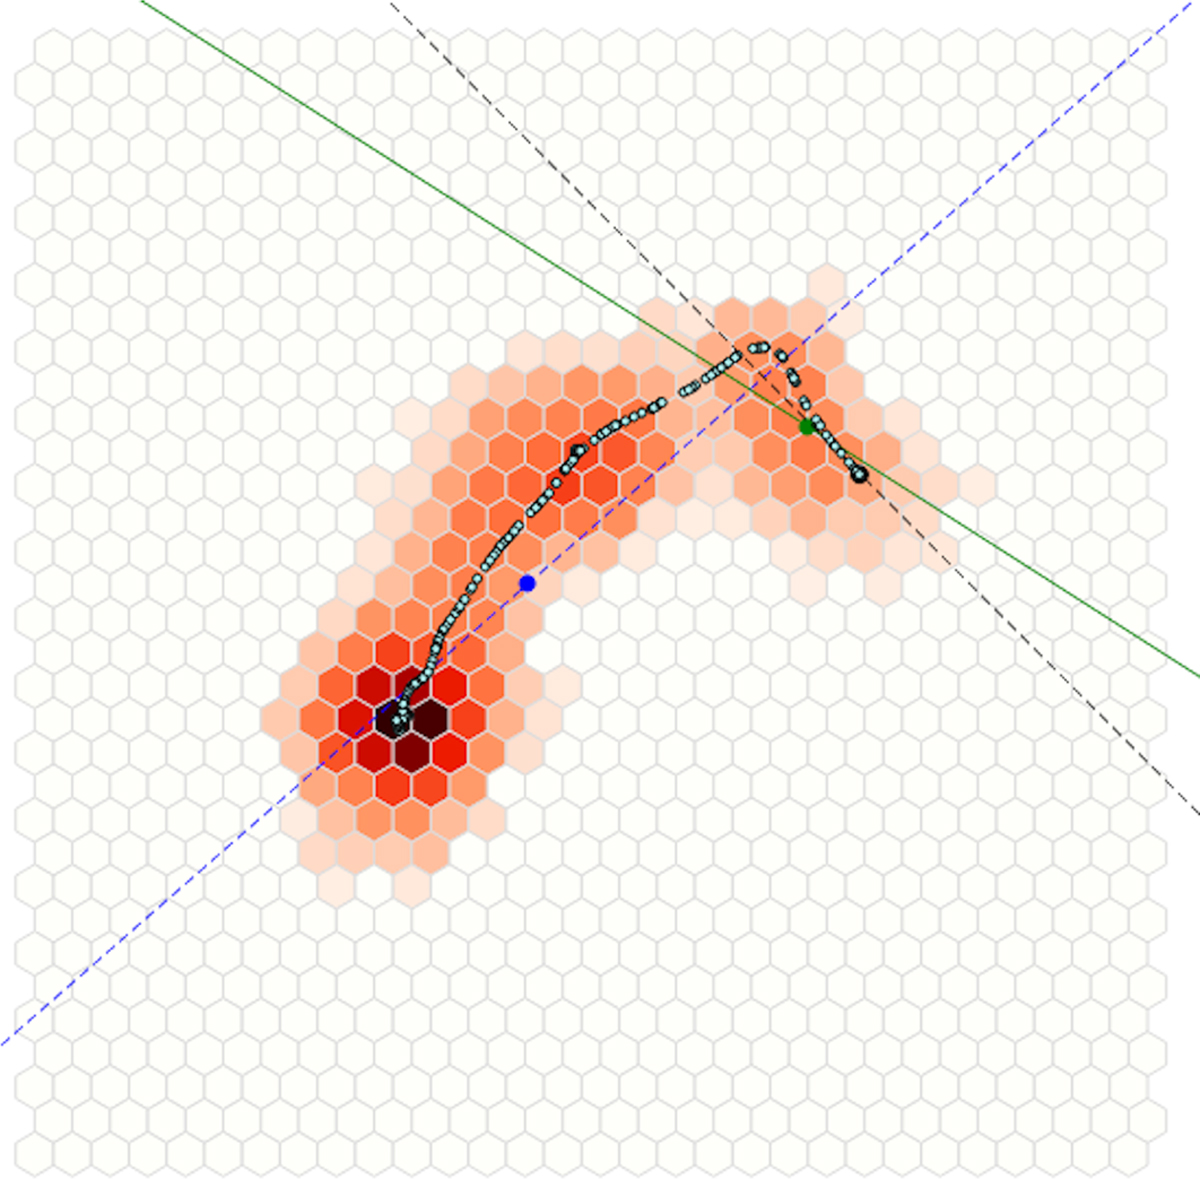
Example of a 7.5 keV PE track with all the parameters reconstructed with moment analysis. The blue point and the dashed blue line are the barycenter and the direction of maximum elongation of the track, respectively. The green point and the green line are the reconstructed impact point and the reconstructed emission direction, respectively. The black point and the dashed black line are the true (MC) impact point and emission direction, respectively.
Current usage metrics show cumulative count of Article Views (full-text article views including HTML views, PDF and ePub downloads, according to the available data) and Abstracts Views on Vision4Press platform.
Data correspond to usage on the plateform after 2015. The current usage metrics is available 48-96 hours after online publication and is updated daily on week days.
Initial download of the metrics may take a while.