Fig. 2.
Download original image
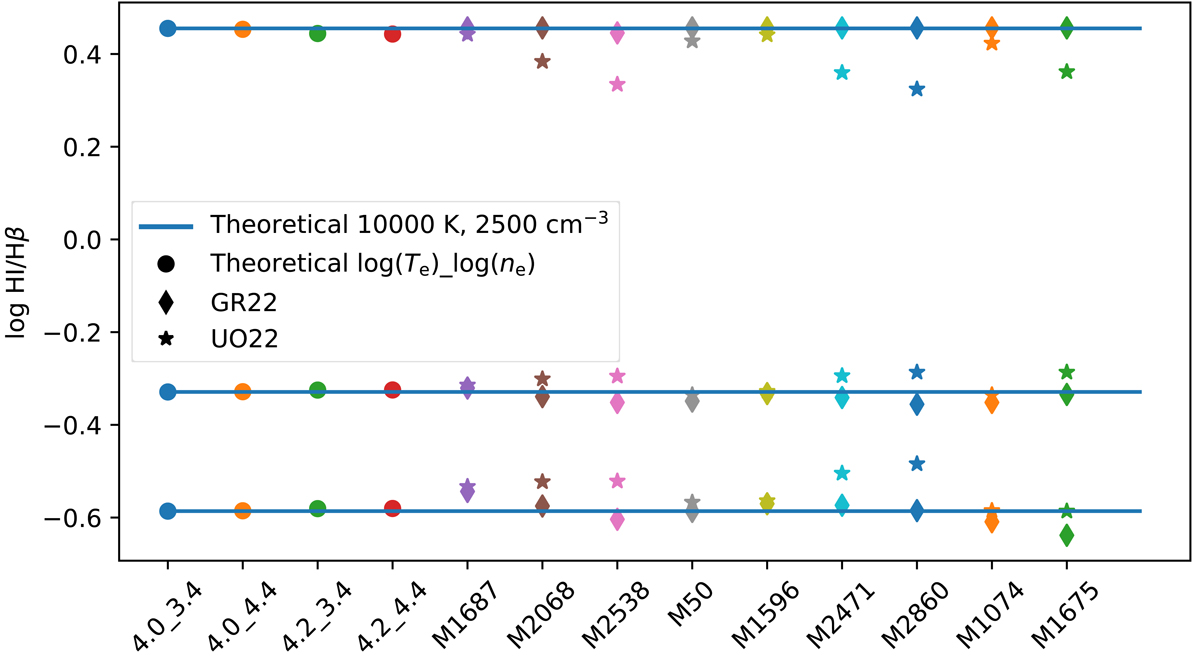
Hα/Hβ, Hγ/Hβ, and Hδ/Hβ line ratios in logarithmic scale, from top to bottom. The first four values of each row (filled circles) correspond to the theoretical values obtained using (log Te, log ne) = (4.0, 3.4), (4.0, 4.4), (4.2, 3.4), and (4.2, 4.4), respectively. The horizontal lines correspond to the value obtained for (4.0, 3.4). The following nine values correspond to the de-reddened line ratios obtained by GR22 (diamonds) and UO22 (stars) for the nine PNe considered in both papers.
Current usage metrics show cumulative count of Article Views (full-text article views including HTML views, PDF and ePub downloads, according to the available data) and Abstracts Views on Vision4Press platform.
Data correspond to usage on the plateform after 2015. The current usage metrics is available 48-96 hours after online publication and is updated daily on week days.
Initial download of the metrics may take a while.