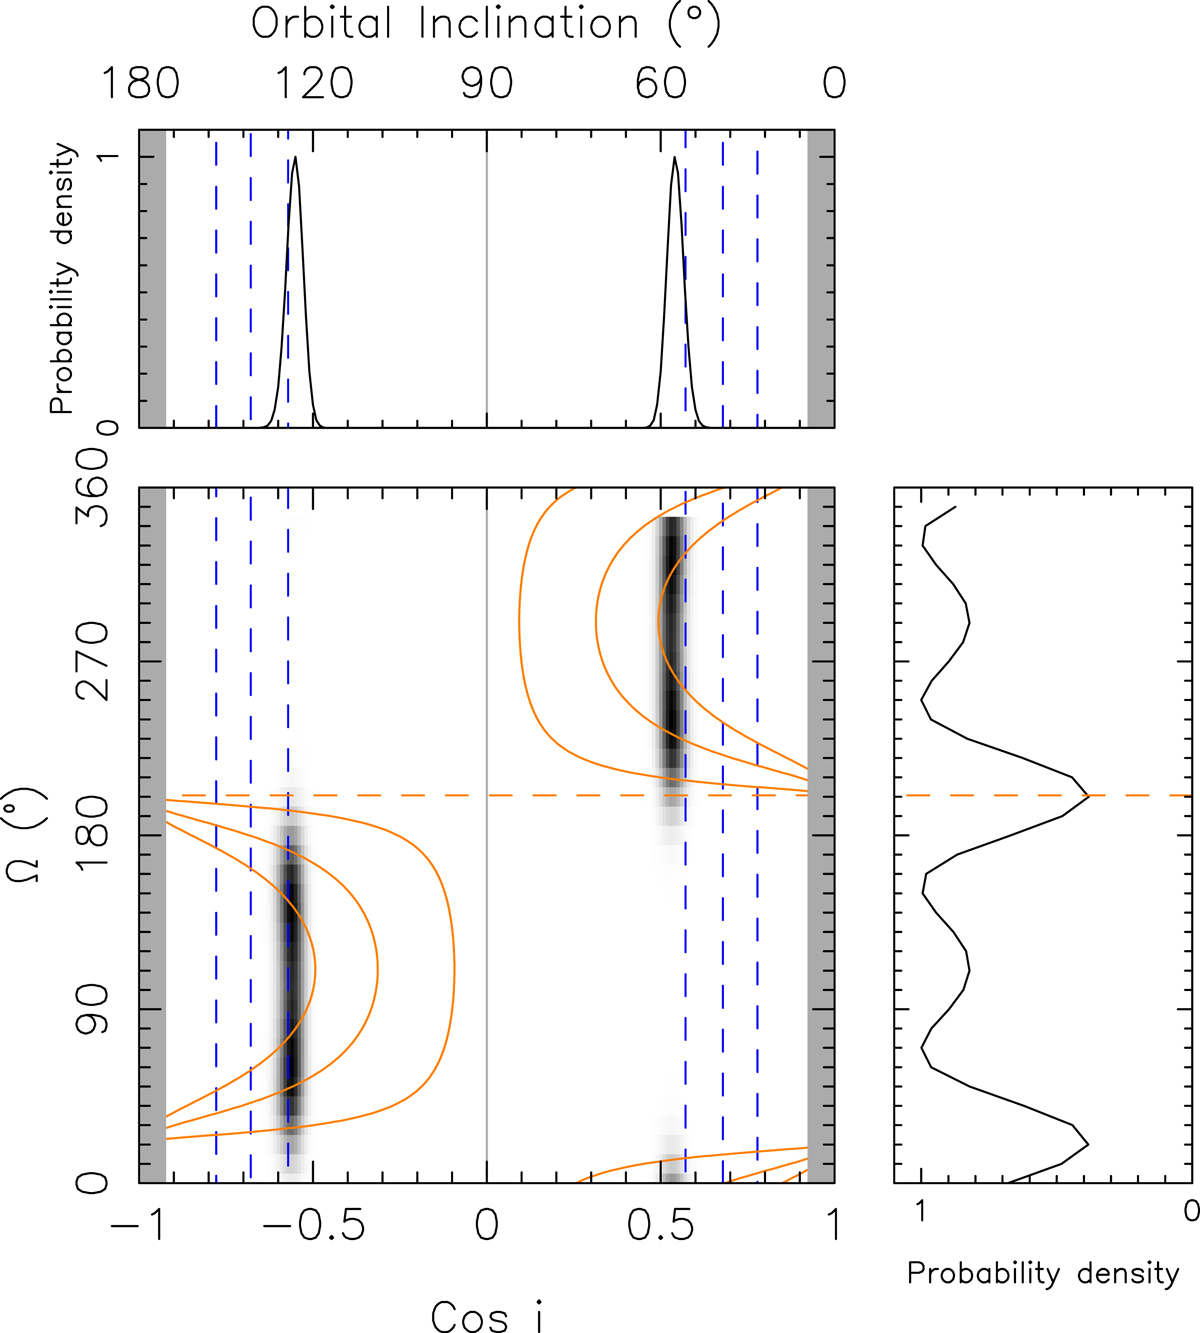
Fig. 8.
Download original image
Constraints on the longitude of the ascending node, Ω, as a function of the cosine of the orbital inclination. The gray shaded regions are excluded by the mass function and the estimate for the total mass of the binary system. The horizontal dashed orange line indicates the position angle of the proper motion, Θμ. The constraints given by ẋobs and its 1-σ uncertainty are displayed as solid orange lines, the constraints given by the measurement of ς are given by the blue dashed lines. These parameters are as measured with the DDH model. The grayscale maps represent the joint posterior pdf for cos i and Ω, with darker shades corresponding to higher probabilities. The marginal plots display the marginalized posterior pdfs for cos i and Ω. In the right-hand panel, the probability density increases from right to left.
Current usage metrics show cumulative count of Article Views (full-text article views including HTML views, PDF and ePub downloads, according to the available data) and Abstracts Views on Vision4Press platform.
Data correspond to usage on the plateform after 2015. The current usage metrics is available 48-96 hours after online publication and is updated daily on week days.
Initial download of the metrics may take a while.