Fig. 7.
Download original image
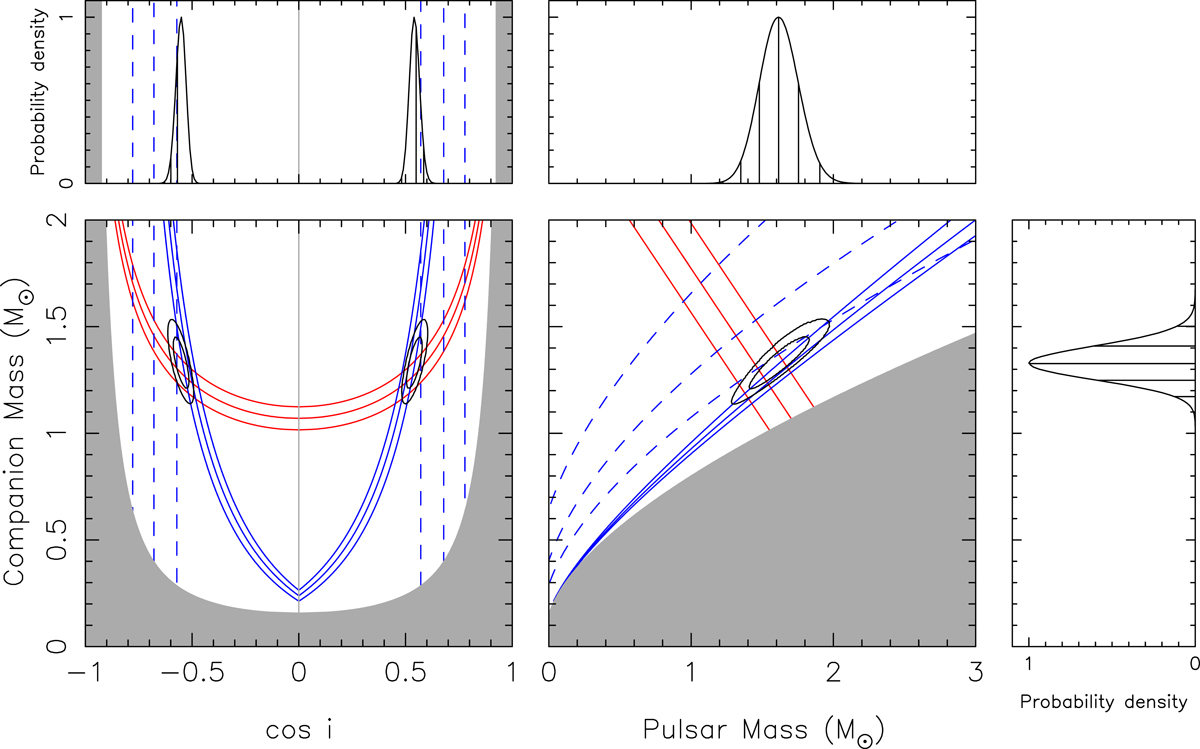
Constraints on the mass of the companion of PSR J1528−3146 as a function of the cosine of the orbital inclination (left), and as a function of the mass of the pulsar (right). In the left-hand plot, the gray region is excluded by the requirement that the pulsar mass must be greater than zero, and the narrow orange region near cos i = 0 is excluded by the marginally significant constraints on ẋ. On the right-hand side of the figure, mass values in the gray region are excluded by the mass function measurement. The solid red lines indicate the contours of the 1σ uncertainty regions for ![]() , the 1σ uncertainty regions for h3 (resp., ς) are displayed as solid blue (resp., dashed blue) lines; these parameters are measured in the DDH orbital model. The solid contours include 1σ and 2σ equivalent percentiles for the joint posterior pdfs for cos i and Mc (left) and Mc − Mc (right). The marginalized posterior pdfs for cos i, Mc and Mp are displayed for each plot axis. In the right-hand panel, the probability density increases from right to left.
, the 1σ uncertainty regions for h3 (resp., ς) are displayed as solid blue (resp., dashed blue) lines; these parameters are measured in the DDH orbital model. The solid contours include 1σ and 2σ equivalent percentiles for the joint posterior pdfs for cos i and Mc (left) and Mc − Mc (right). The marginalized posterior pdfs for cos i, Mc and Mp are displayed for each plot axis. In the right-hand panel, the probability density increases from right to left.
Current usage metrics show cumulative count of Article Views (full-text article views including HTML views, PDF and ePub downloads, according to the available data) and Abstracts Views on Vision4Press platform.
Data correspond to usage on the plateform after 2015. The current usage metrics is available 48-96 hours after online publication and is updated daily on week days.
Initial download of the metrics may take a while.