Fig. 3.
Download original image
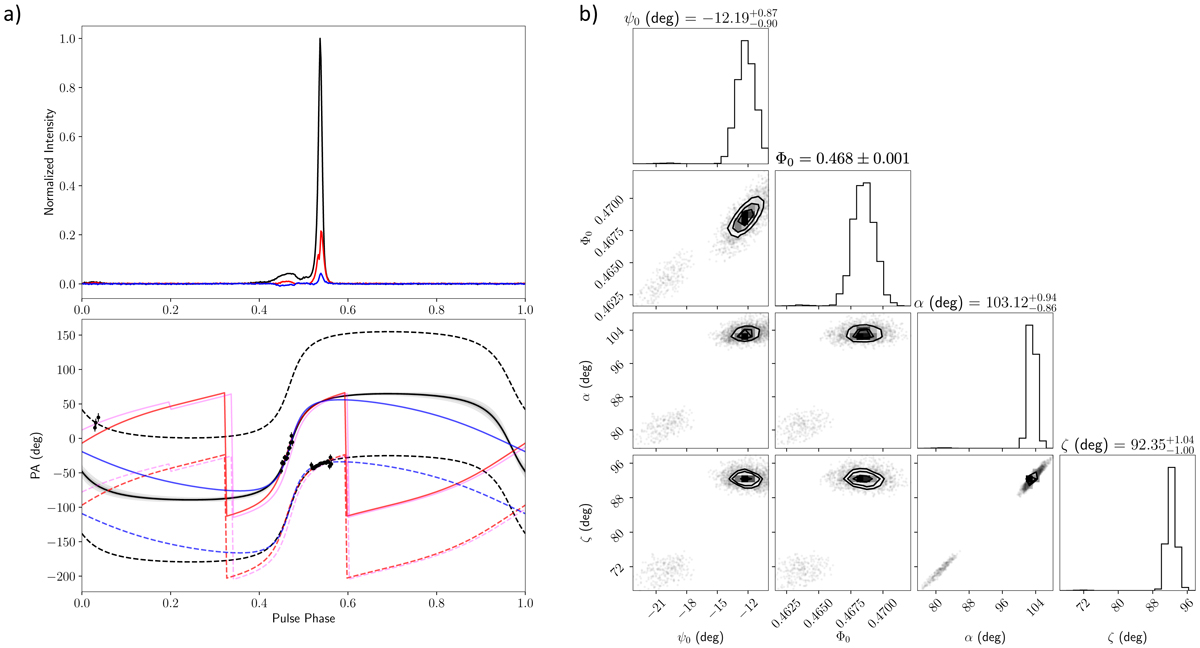
Rotating vector model analysis of PSR J1528−3146. Left: top panel shows the polarization profile of PSR J1528−3146 as observed at 1284 MHz. The black line represents total power, the red shows linearly and the blue line circularly polarized intensity, respectively. Bottom panel displays the derived PPA values and a number of RVM fits. The black lines represents the resulting RVM for an unconstrained fit covering the whole parameter space. The dashed lines indicate vertical shifts of the RVM by ±90° to represent possible orthogonal polarized modes. The red and blue curves are RVM fits for a restricted range of ζ, forcing it to be consistent with values of the orbital inclination angle as derived from timing in this paper. The magenta line displays a possible shift in the emission height between the main pulse and the interpulse. See text for details. Right: corner plot of the posterior distributions of the joint RVM model parameters, with the off-diagonal elements representing the correlations between parameters and the diagonal elements denoting the marginalized histograms. The posteriors shown here are derived for the unconstrained fit leading to the black line on the left.
Current usage metrics show cumulative count of Article Views (full-text article views including HTML views, PDF and ePub downloads, according to the available data) and Abstracts Views on Vision4Press platform.
Data correspond to usage on the plateform after 2015. The current usage metrics is available 48-96 hours after online publication and is updated daily on week days.
Initial download of the metrics may take a while.