Fig. B.1.
Download original image
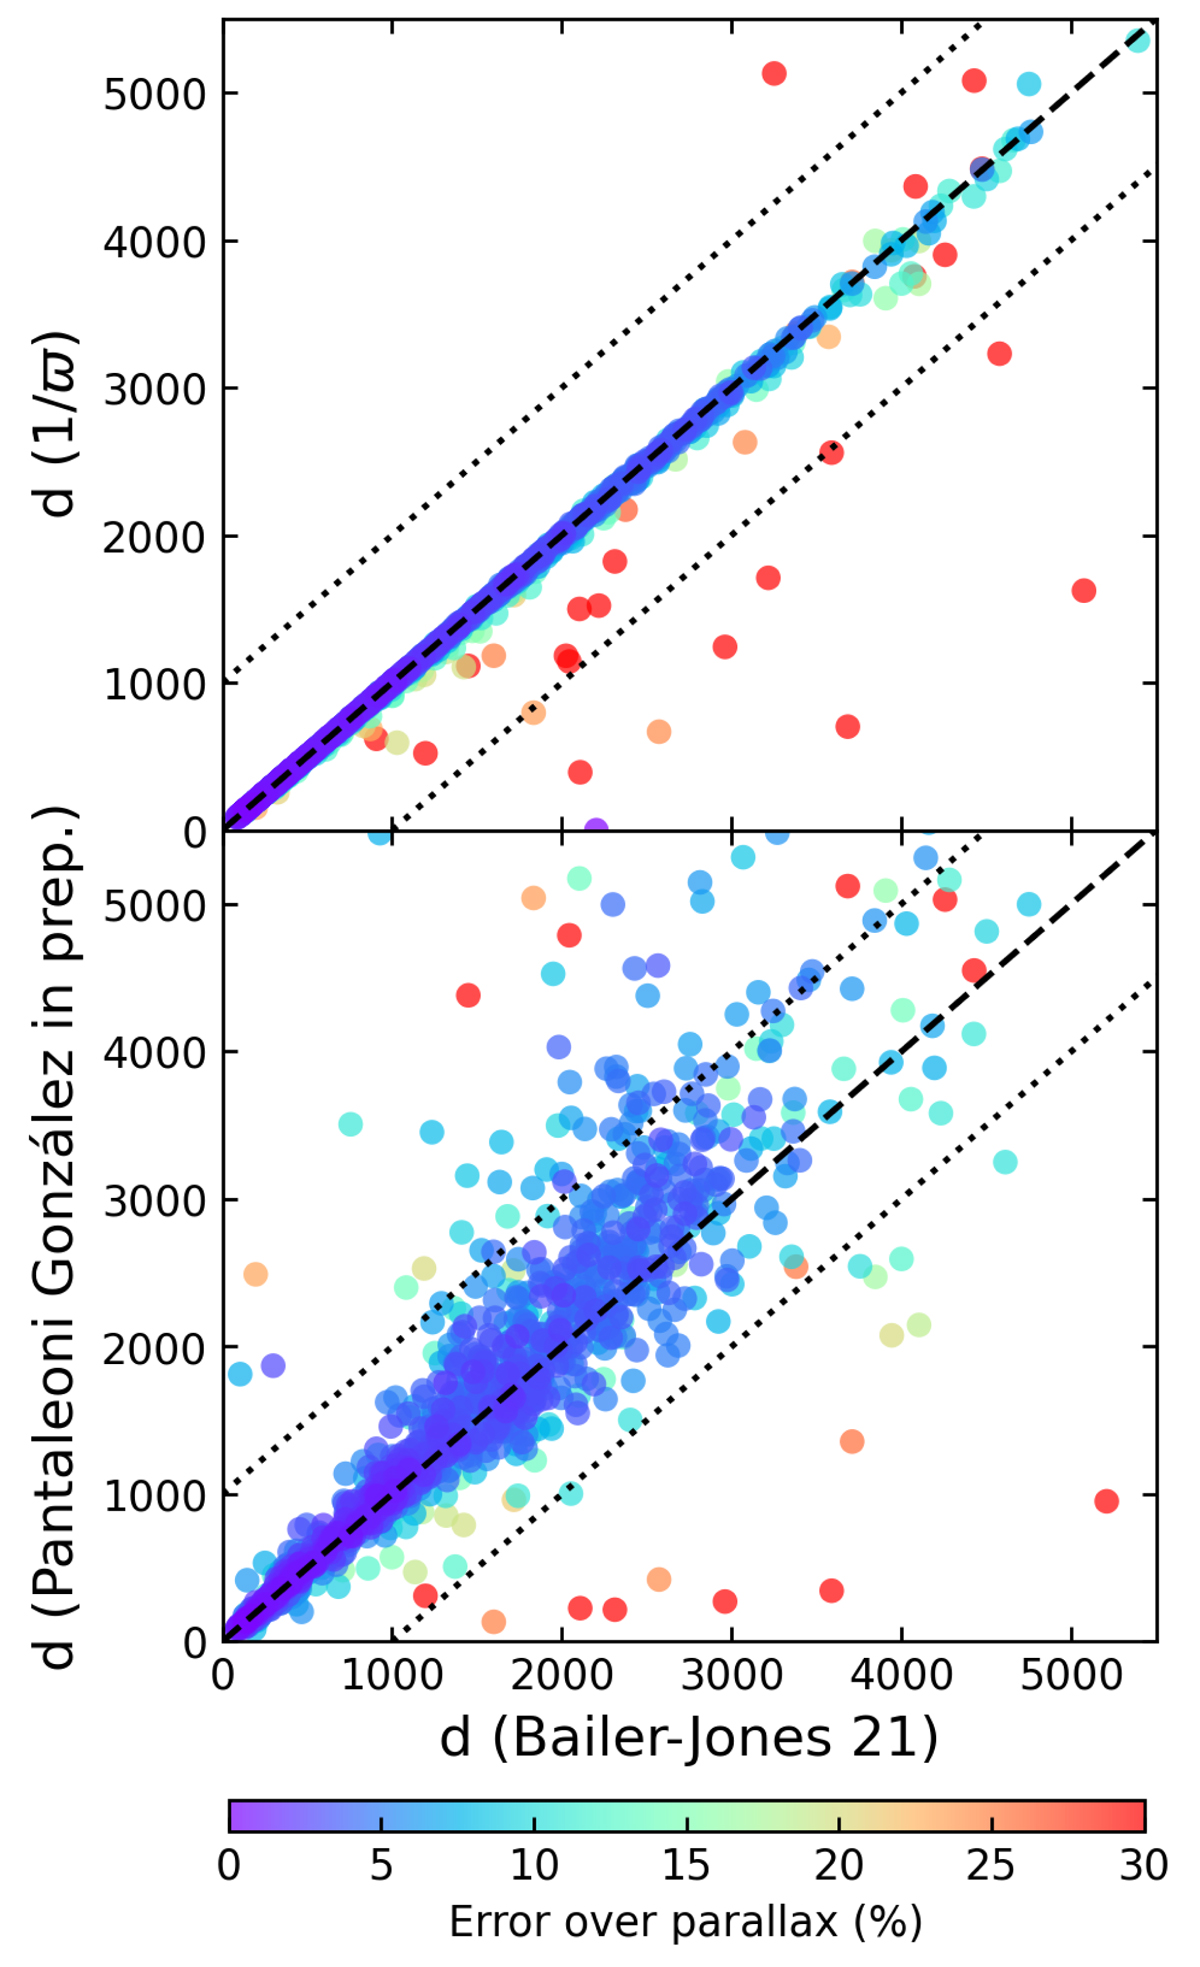
Comparison between distances derived from Gaia. In the top panel, distances from the inverse of the parallax (corrected for the zeropoint) against the distances from Bailer-Jones et al. (2021) for the initial full sample of O9 – B9 type stars. In the bottom panel, distances from Pantaleoni González, et al. (in prep.) against those from Bailer-Jones et al. (2021). The stars are color-coded by their error over parallax from the Gaia DR3 data. In both panels, the two dotted lines indicate a deviation of ±1 000 pc.
Current usage metrics show cumulative count of Article Views (full-text article views including HTML views, PDF and ePub downloads, according to the available data) and Abstracts Views on Vision4Press platform.
Data correspond to usage on the plateform after 2015. The current usage metrics is available 48-96 hours after online publication and is updated daily on week days.
Initial download of the metrics may take a while.