Fig. 16.
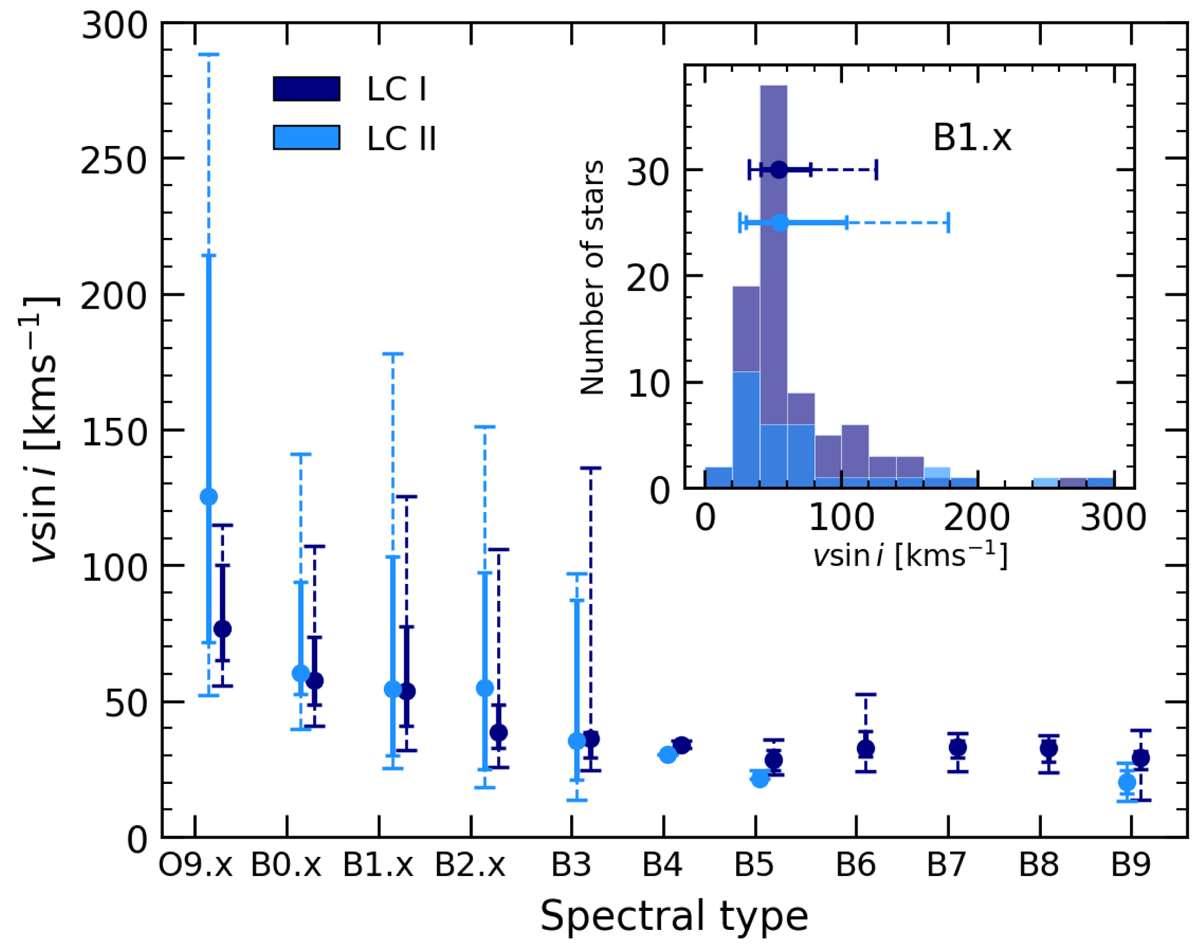
Download original image
Main panel: distribution of the median of v sin i obtained through the GoF method of IACOB-BROAD against the SpT, separated into stars with LCs I and II. The solid error bars indicate the upper and lower limits corresponding to the 75% and 25% percentiles, and the dashed error bars correspond to 90% and 10% percentiles. Stars without LC or SB2+ systems are not included. Small panel: histogram of the subsample of B1 I–II stars against the v sin i for a better interpretation of the main paneland Sect. 4.3. The error bars corresponding to the B1 I–II stars are plotted horizontally.
Current usage metrics show cumulative count of Article Views (full-text article views including HTML views, PDF and ePub downloads, according to the available data) and Abstracts Views on Vision4Press platform.
Data correspond to usage on the plateform after 2015. The current usage metrics is available 48-96 hours after online publication and is updated daily on week days.
Initial download of the metrics may take a while.