Open Access
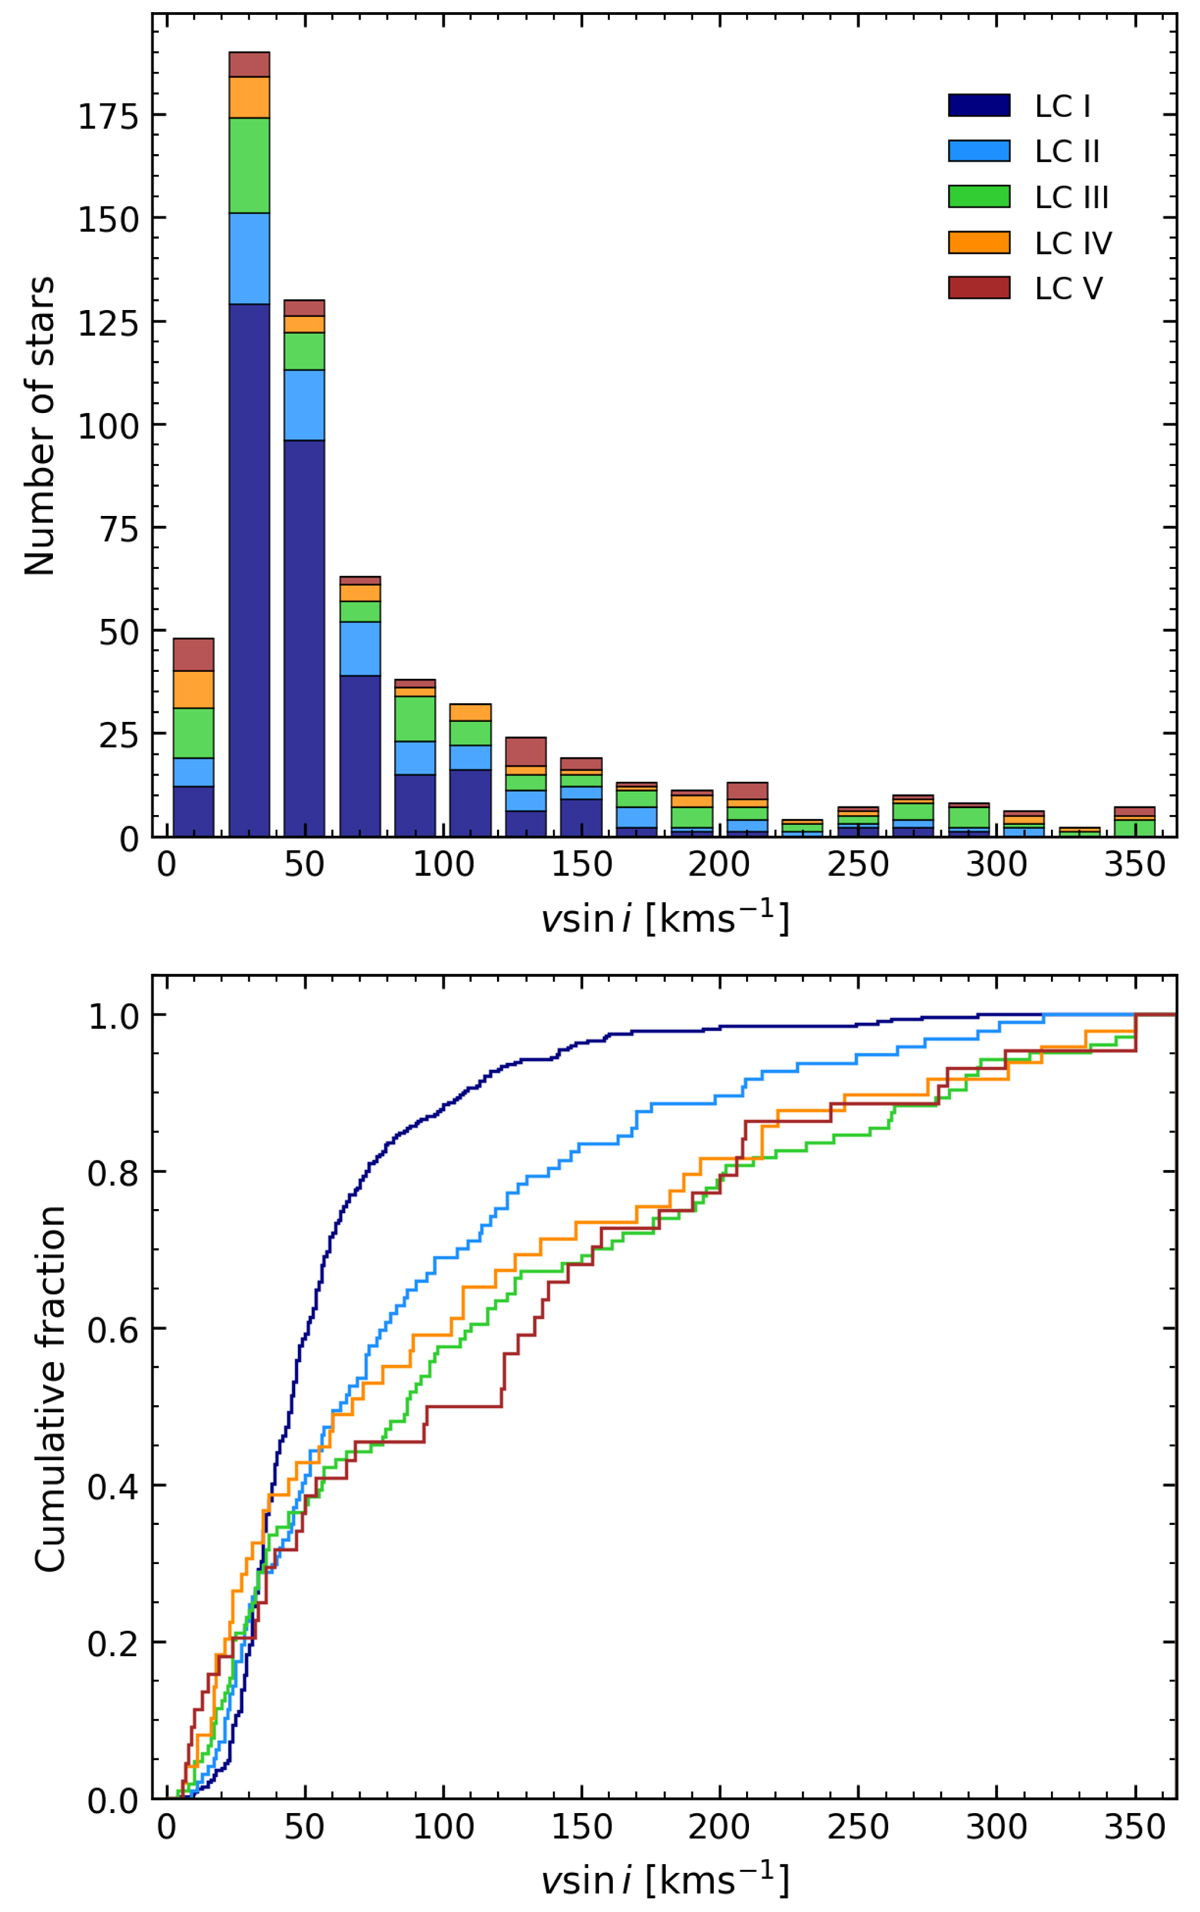
Fig. 15.
Download original image
Histogram and cumulative distribution of the v sin i in the sample stars, excluding the identified SB2+ stars. In the top panel, each bin of the histogram is 20 km s−1 wide and stacks the stars separated and color-coded by their LC. In the bottom panel, we plot the cumulative distributions separated by LCs.
Current usage metrics show cumulative count of Article Views (full-text article views including HTML views, PDF and ePub downloads, according to the available data) and Abstracts Views on Vision4Press platform.
Data correspond to usage on the plateform after 2015. The current usage metrics is available 48-96 hours after online publication and is updated daily on week days.
Initial download of the metrics may take a while.