Fig. 13.
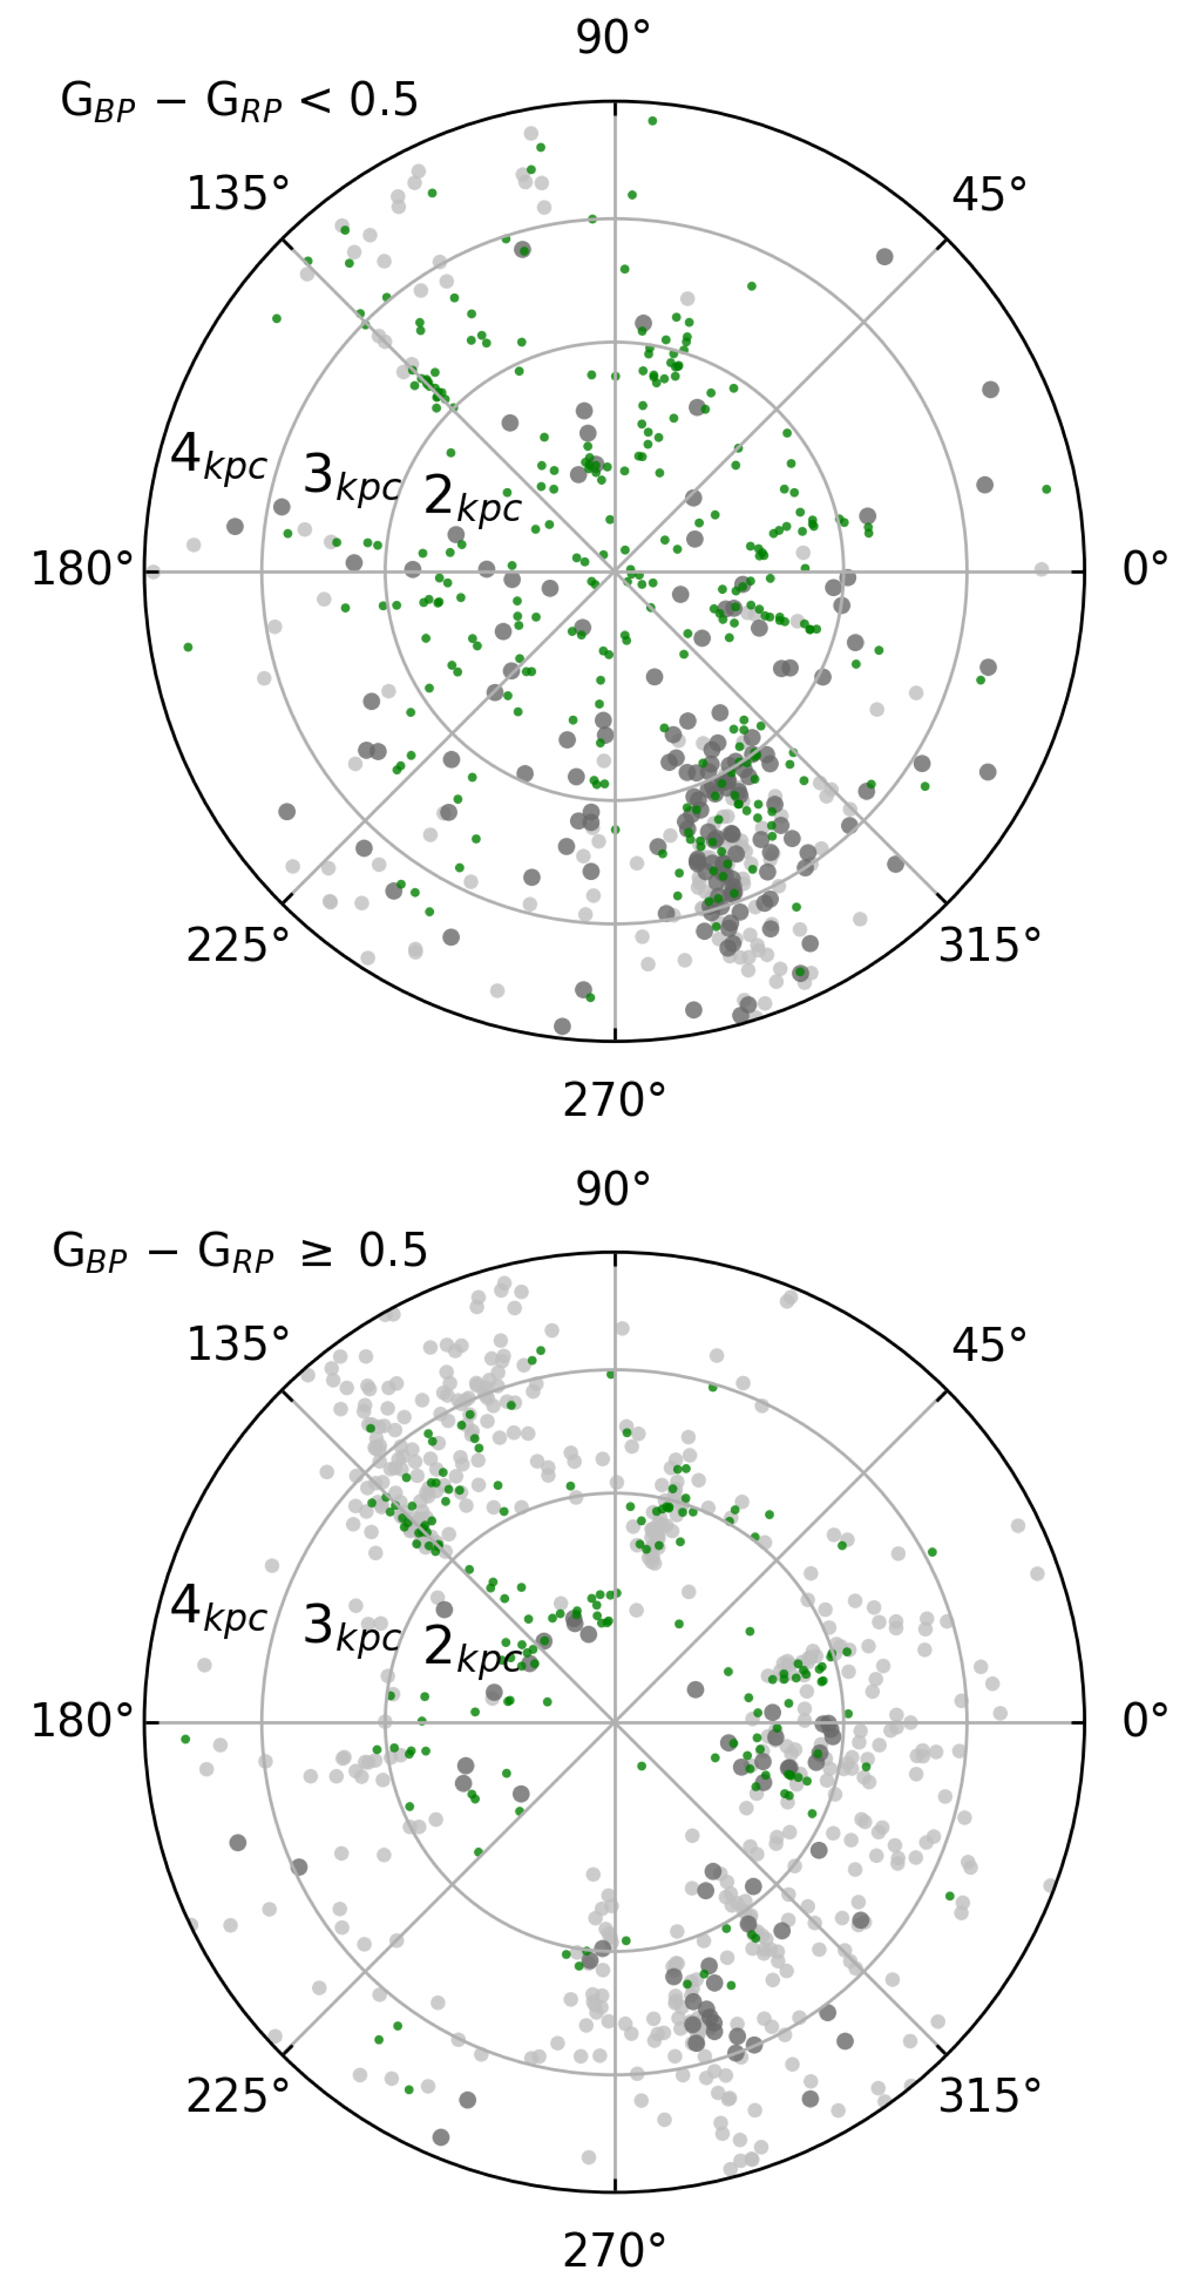
Download original image
Two polar plots in Galactic coordinates of all the stars above the top reddening line of Fig. 11, separating in the top and bottom panels those with GBP − GRP ≶ 0.5. In both panels, light gray or gray circles indicate missing stars separating those with 9 < Bmag < 11 or Bmag < 9, respectively, and with green circles the stars for which spectroscopic data are available.
Current usage metrics show cumulative count of Article Views (full-text article views including HTML views, PDF and ePub downloads, according to the available data) and Abstracts Views on Vision4Press platform.
Data correspond to usage on the plateform after 2015. The current usage metrics is available 48-96 hours after online publication and is updated daily on week days.
Initial download of the metrics may take a while.