Fig. 11.
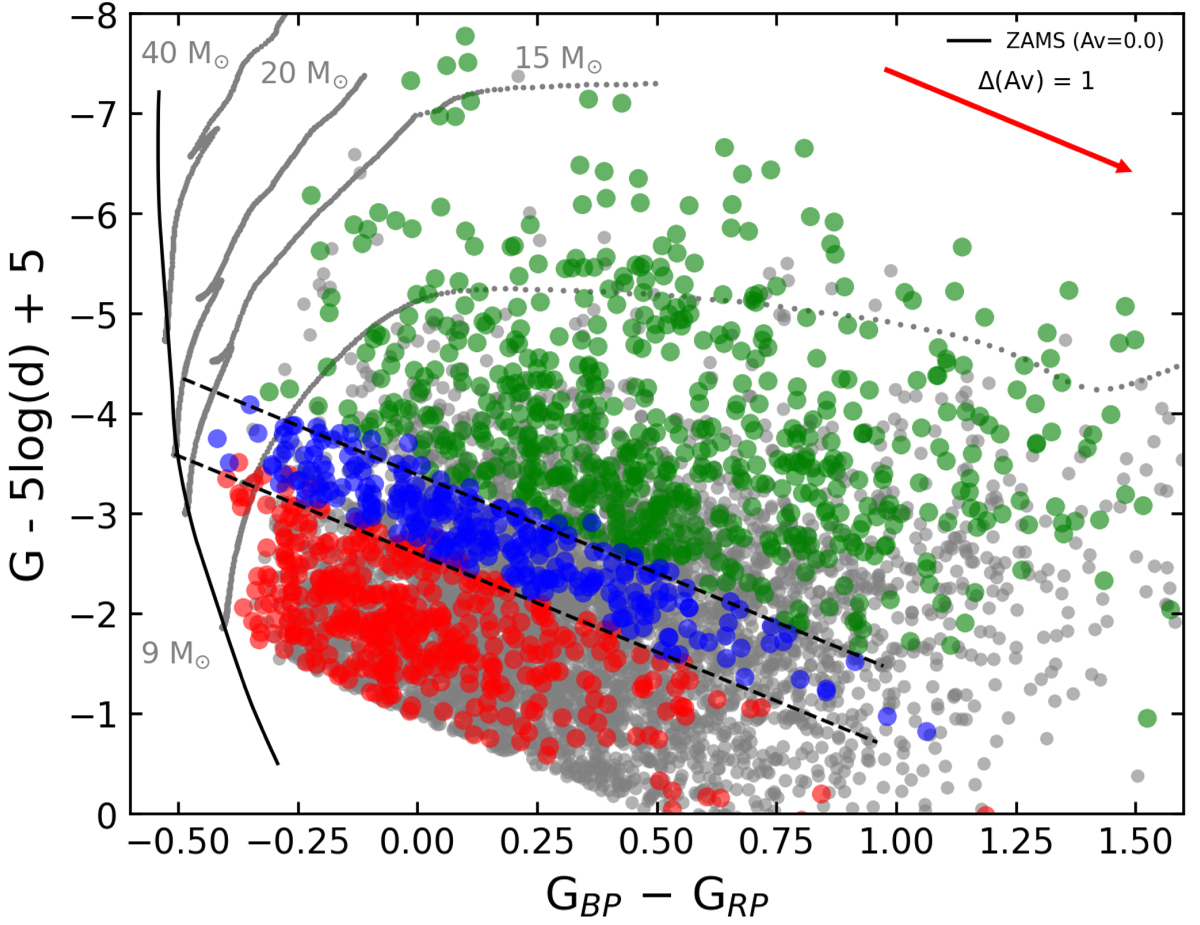
Download original image
Same as Fig. 10, but now including O9 to B9 stars from the ALS III catalog (Pantaleoni González et al., in prep.) limited to stars Bmag < 11, and distances of 4000 pc. The two diagonal dashed black lines mark the reddening line of a 20 M⊙ star. They establish three regions in the diagram that are expected to be mostly correlated with log(ℒ/ℒ⊙), as described in Sect. 4.2.2. The bottom line starts from the ZAMS, and the top line starts from the approximate age at which it intersects the horizontal dashed black line in the left panel of Fig. 5 at log(ℒ/ℒ⊙) = 3.5 dex. Both extended up to a Δ(Av) = 2. The stars in the full sample of observed O9–B9 type stars for which the upper and lower distances based on the errors lie above the top reddening line are shown in green, those for which one of the distances lies between the two reddening lines are shown in blue, and those for which one of the distances lies below the bottom reddening line are shown in red. The remaining stars populating the CMD are plotted in gray and correspond to stars that are not yet observed. Four tracks from MESA with Av = 0.0 and no initial rotation are included for 9 M⊙, 15 M⊙, 20 M⊙, and 40 M⊙.
Current usage metrics show cumulative count of Article Views (full-text article views including HTML views, PDF and ePub downloads, according to the available data) and Abstracts Views on Vision4Press platform.
Data correspond to usage on the plateform after 2015. The current usage metrics is available 48-96 hours after online publication and is updated daily on week days.
Initial download of the metrics may take a while.