Open Access
Fig. 7
Download original image
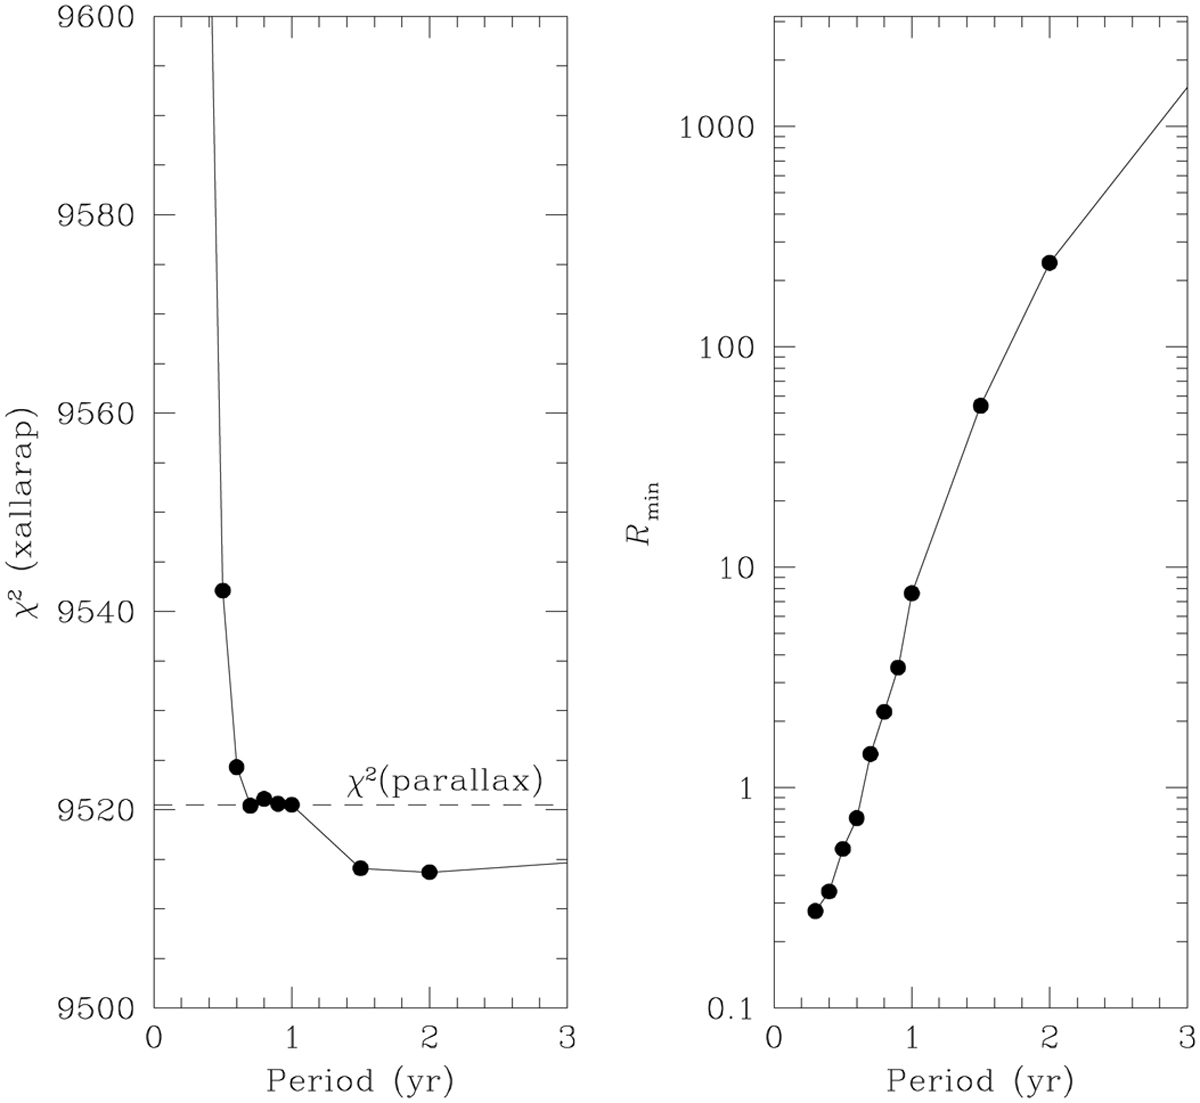
Results of the xallarap modeling. Left panel shows the χ2 values of the xallarap fits as a function of the source orbital period and the right panel shows the lower limit of R = Q3/(1 + Q)2 as a function of the period. The dashed horizontal line in the left panel indicates the χ2 value of the parallax fit.
Current usage metrics show cumulative count of Article Views (full-text article views including HTML views, PDF and ePub downloads, according to the available data) and Abstracts Views on Vision4Press platform.
Data correspond to usage on the plateform after 2015. The current usage metrics is available 48-96 hours after online publication and is updated daily on week days.
Initial download of the metrics may take a while.