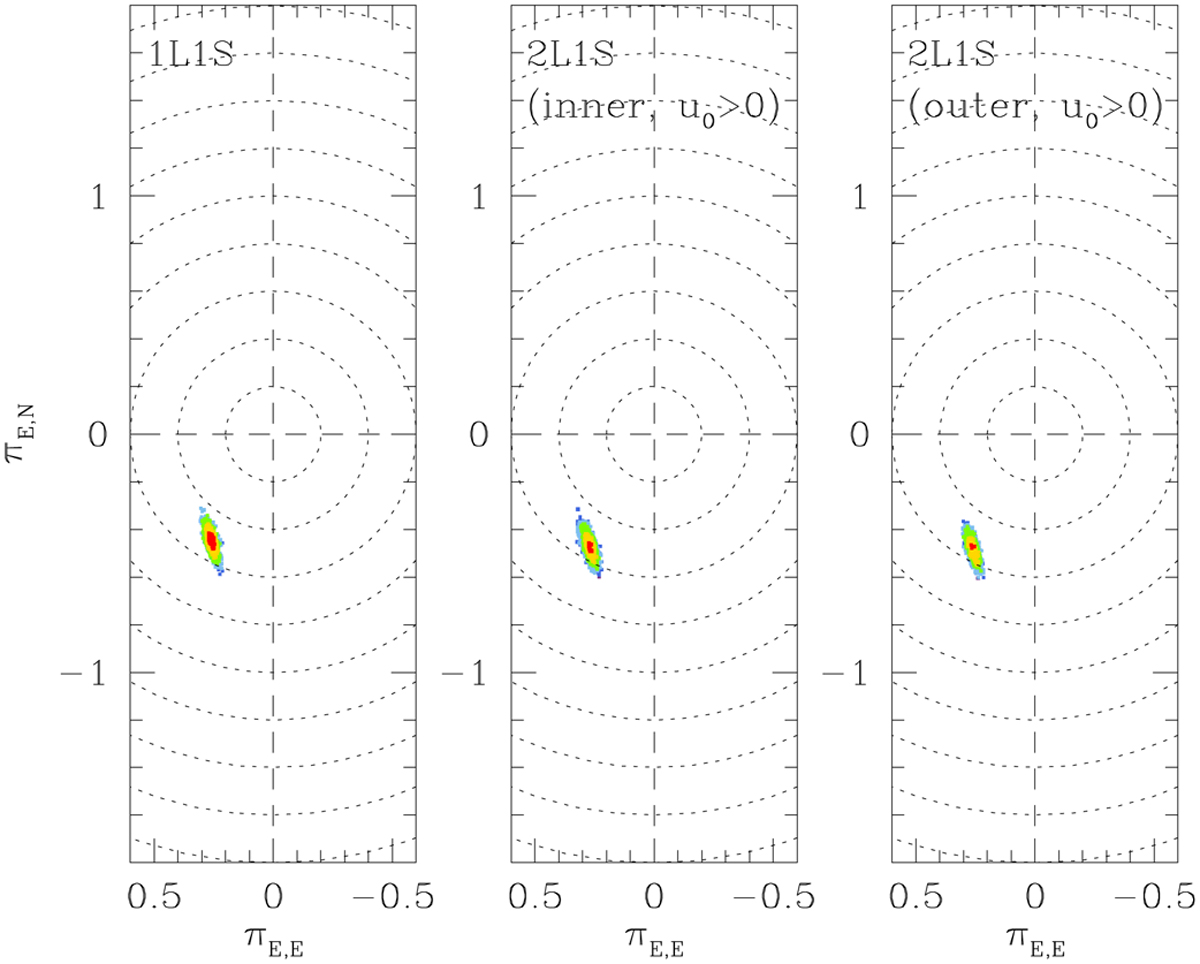
Fig. 5
Download original image
Scatter plots of the MCMC points in the chains of the 1L1S, and the inner and outer 2L1S solutions on the (πE,E,πE,N) parameter plane. In all cases, we present plots of the solutions with u0 > 0, while the solutions with u0 < 0 result in similar plots. The dotted circles are drawn at every 0.2πE interval. The color coding is same as that used in Fig. 4.
Current usage metrics show cumulative count of Article Views (full-text article views including HTML views, PDF and ePub downloads, according to the available data) and Abstracts Views on Vision4Press platform.
Data correspond to usage on the plateform after 2015. The current usage metrics is available 48-96 hours after online publication and is updated daily on week days.
Initial download of the metrics may take a while.