Fig. 3
Download original image
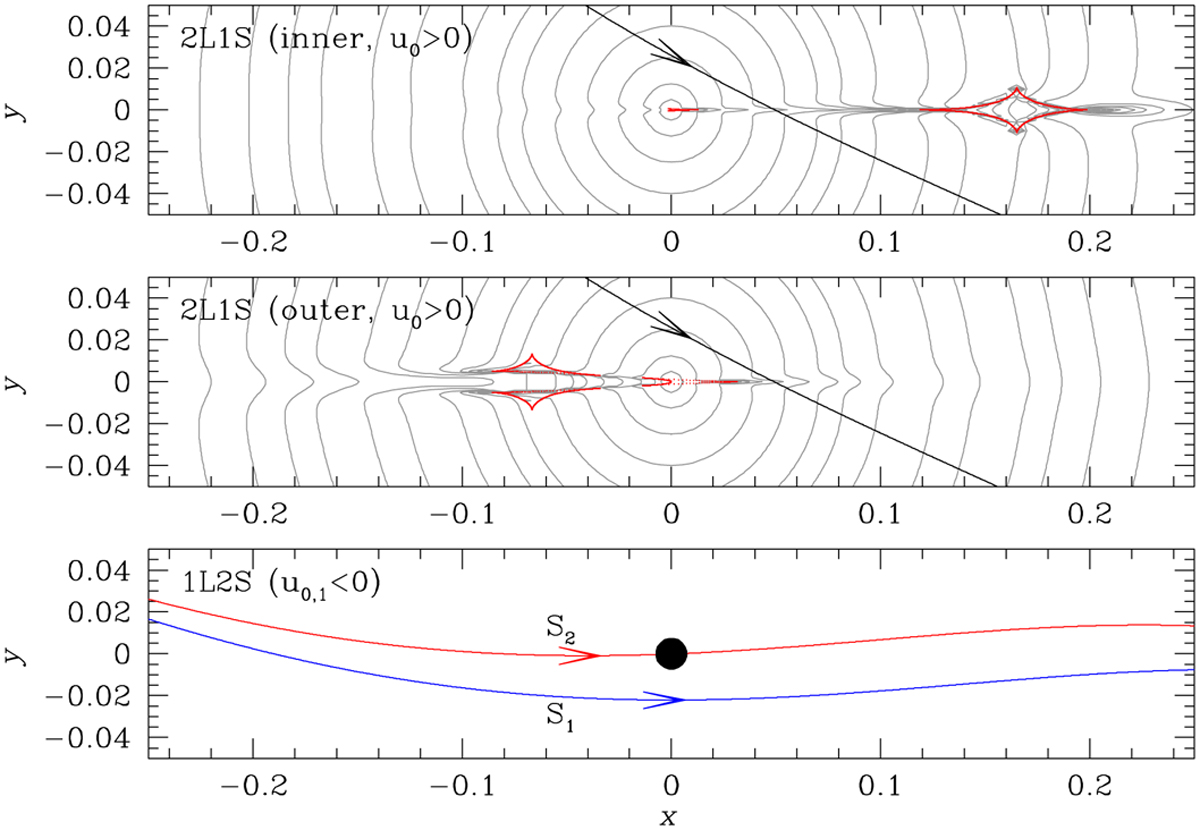
Lens system configurations. Two upper panels show the configurations of the inner and outer 2L1S solutions with u0 > 0 and the bottom panel shows the configuration of the 1L2S solution with u0,1 < 0. In each of the panels showing the 2L1S configurations, the red cuspy figures represent caustics, the line with an arrow is the source trajectory, and grey curves encompassing the caustic are equi-magnification contours. In the panel of the 1L2S solution, the black filled dot represent the lens, and the blue and red curves denote the trajectories of the primary (marked by S1) and secondary (marked by S1) source stars, respectively.
Current usage metrics show cumulative count of Article Views (full-text article views including HTML views, PDF and ePub downloads, according to the available data) and Abstracts Views on Vision4Press platform.
Data correspond to usage on the plateform after 2015. The current usage metrics is available 48-96 hours after online publication and is updated daily on week days.
Initial download of the metrics may take a while.