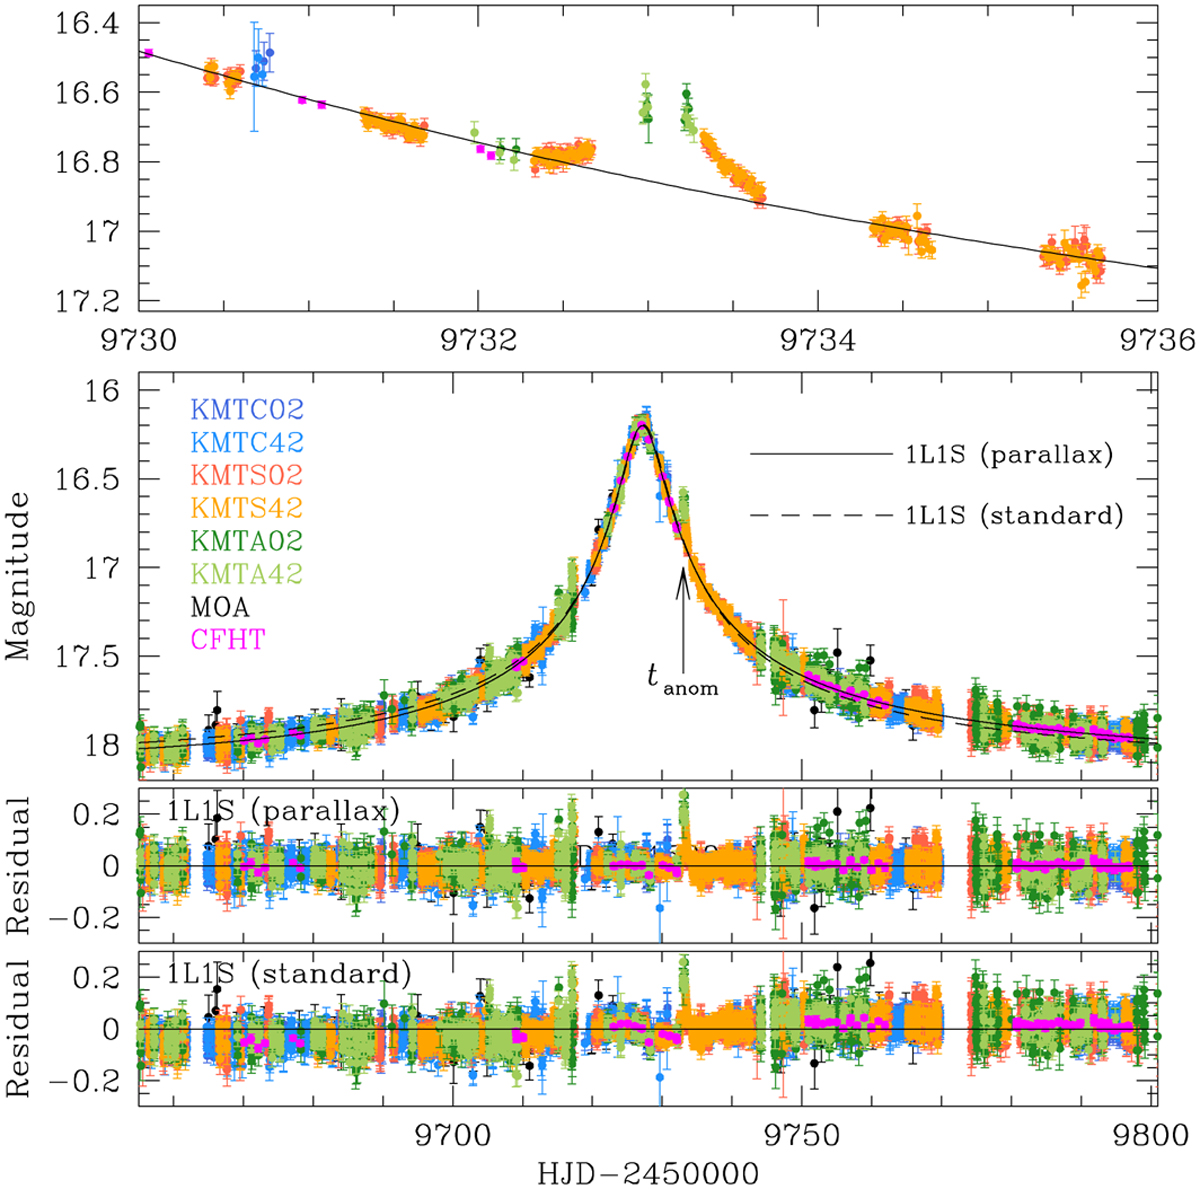
Fig. 1
Download original image
Light curve of the microlensing event MOA-2022-BLG-249. The arrow marked by tanom in the second panel indicates the location of the anomaly. Top panel shows the enlarged view around the anomaly region. The solid and dashed curves drawn over the data points are 1L1S models obtained with (parallax model) and without (standard model) the consideration of microlens-parallax effects. Two lower panels shows the residuals from the two models.
Current usage metrics show cumulative count of Article Views (full-text article views including HTML views, PDF and ePub downloads, according to the available data) and Abstracts Views on Vision4Press platform.
Data correspond to usage on the plateform after 2015. The current usage metrics is available 48-96 hours after online publication and is updated daily on week days.
Initial download of the metrics may take a while.