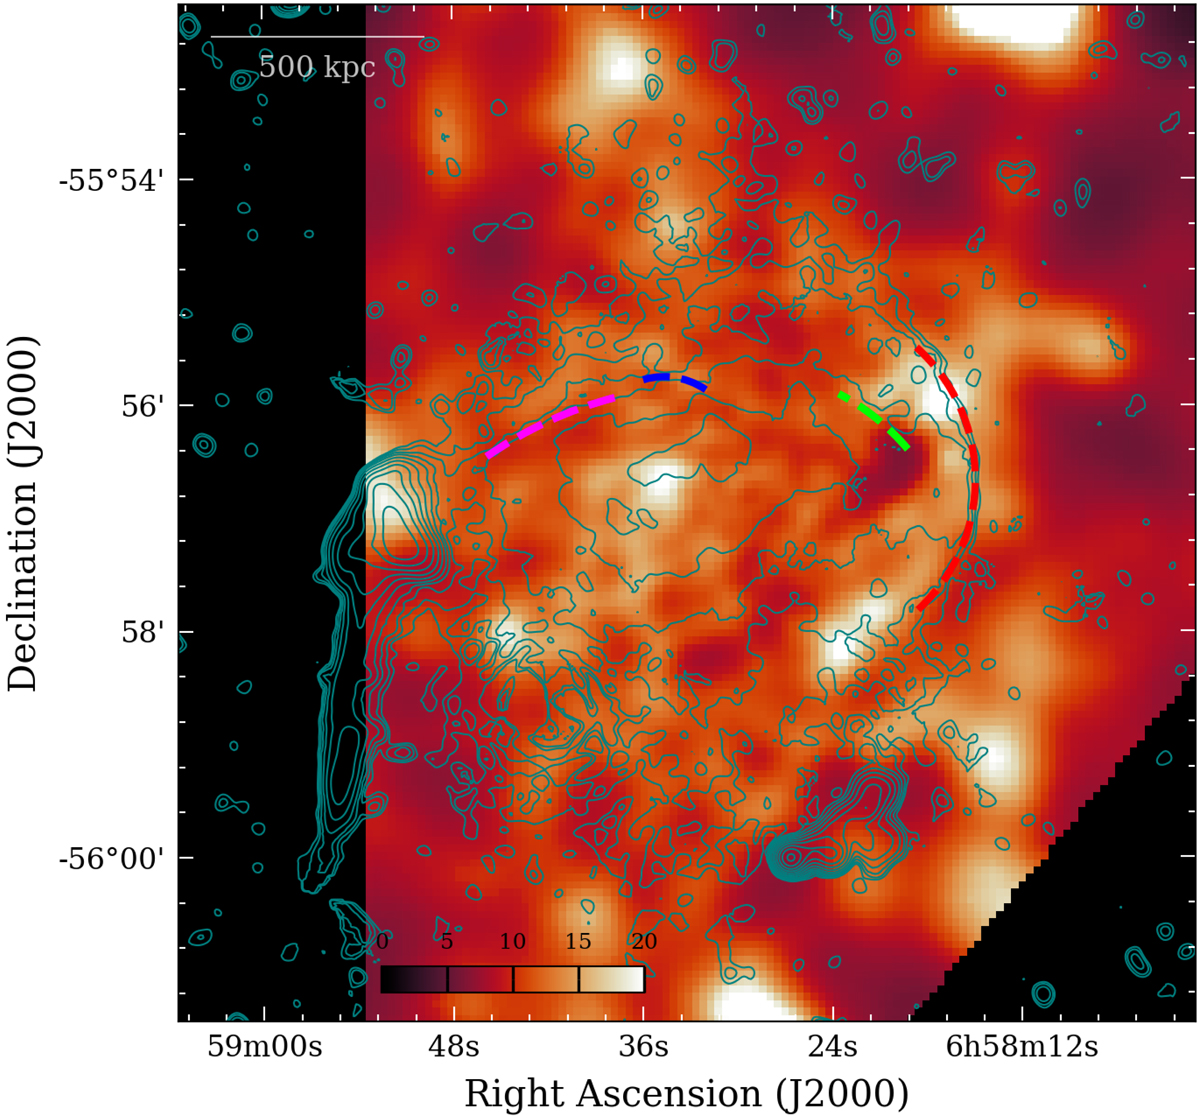
Fig. 6.
Download original image
Temperature map in keV units of the Bullet Cluster derived from the Chandra data following the method described in Markevitch et al. (2000) and Wang et al. (2016). Contours show the radio emission from the MeerKAT discrete source-subtracted image spaced by a factor of 2 starting from 3 × rms. Dashed arcs mark the positions of the radio surface brightness discontinuities. The corresponding error map is reported in Appendix A.
Current usage metrics show cumulative count of Article Views (full-text article views including HTML views, PDF and ePub downloads, according to the available data) and Abstracts Views on Vision4Press platform.
Data correspond to usage on the plateform after 2015. The current usage metrics is available 48-96 hours after online publication and is updated daily on week days.
Initial download of the metrics may take a while.