Fig. 5.
Download original image
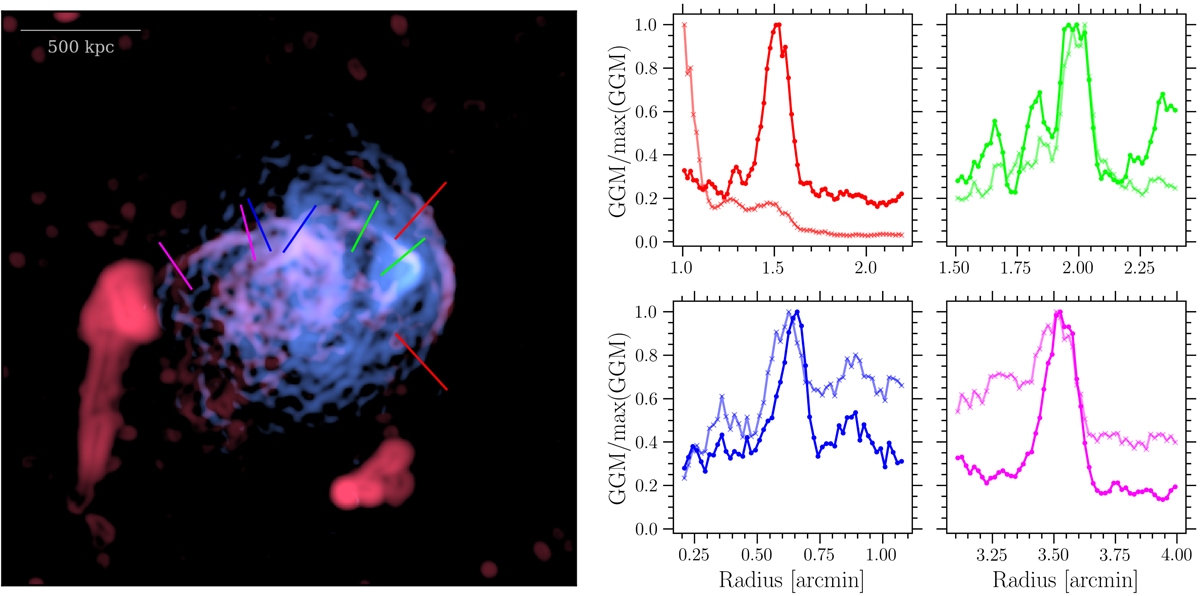
Comparison between radio and X-ray surface brightness gradients. Left panel: composite image of the gradients in the Bullet Cluster. The MeerKAT GGM-filtered image is reported in red while the Chandra GGM-filtered image is reported in blue. Right panels: profiles extracted from the MeerKAT (dots, darker colors) and Chandra (crosses, lighter colors) GGM-filtered images in the four analyzed sectors, following the same color scheme. The profiles are normalized to the maximum value in the sector.
Current usage metrics show cumulative count of Article Views (full-text article views including HTML views, PDF and ePub downloads, according to the available data) and Abstracts Views on Vision4Press platform.
Data correspond to usage on the plateform after 2015. The current usage metrics is available 48-96 hours after online publication and is updated daily on week days.
Initial download of the metrics may take a while.