Fig. 8
Download original image
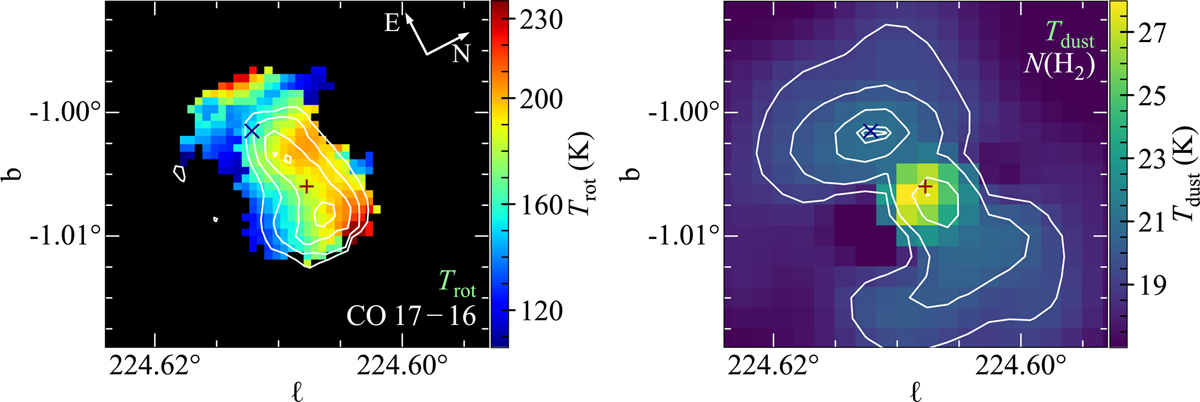
Gas and dust temperatures toward Gy 3–7. Left: CO rotational temperature map obtained using Boltzmann diagrams. White contour map shows the CO 17–16 emission at 25%, 50%, 75%, and 95% of the emission peak. Right: H2 column density contour map overlaid on the dust temperature map derived from the ppmap tool with the Herschel/Hi-GAL survey (Marsh et al. 2017). Contour levels of the N(H2) are at (5, 10, 30, 50, 55) × 1021 cm−2.
Current usage metrics show cumulative count of Article Views (full-text article views including HTML views, PDF and ePub downloads, according to the available data) and Abstracts Views on Vision4Press platform.
Data correspond to usage on the plateform after 2015. The current usage metrics is available 48-96 hours after online publication and is updated daily on week days.
Initial download of the metrics may take a while.