Fig. 7
Download original image
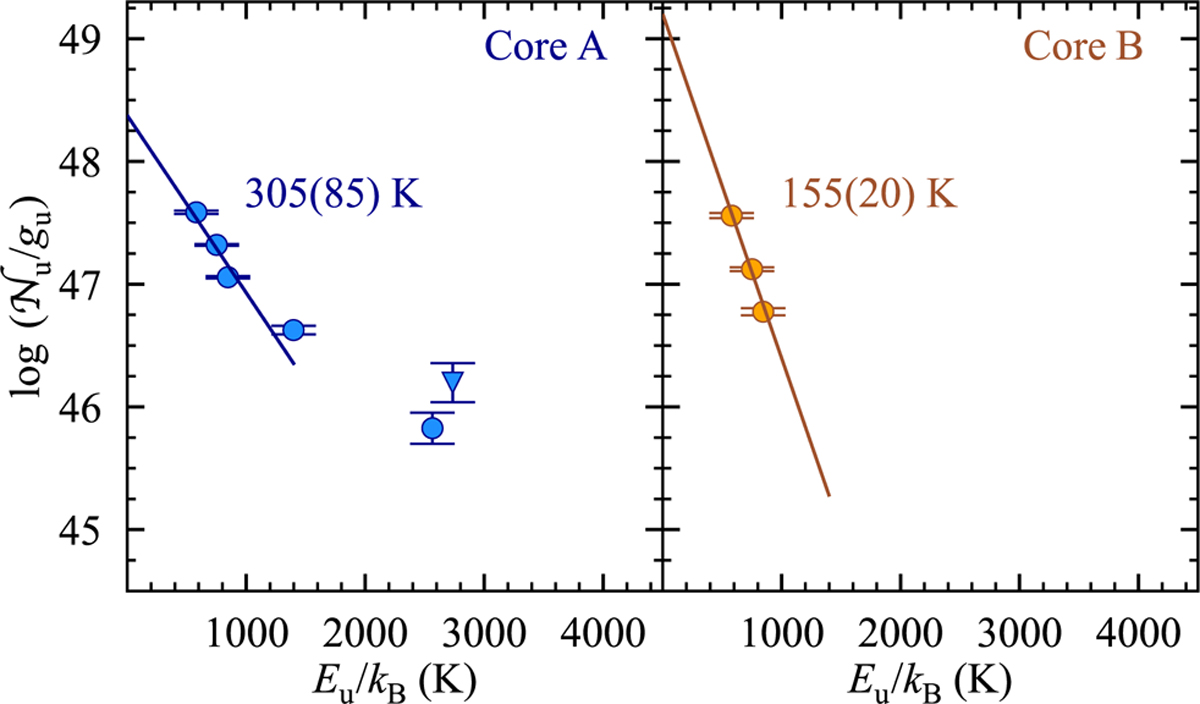
CO rotational diagrams toward core A (left, in blue) and B (right, in orange). Circles refer to values based on line detections and the triangle shows the measurement using the upper limit of the CO 31-30 line, which is blended with OH. Solid lines show fits using transitions belonging to the “warm” gas component; the CO 30–29 line at 87.19 μm is therefore not included. The CO rotational temperature Trot derived from the rotational diagram is labeled in each panel and the value in parenthesis indicates its uncertainty.
Current usage metrics show cumulative count of Article Views (full-text article views including HTML views, PDF and ePub downloads, according to the available data) and Abstracts Views on Vision4Press platform.
Data correspond to usage on the plateform after 2015. The current usage metrics is available 48-96 hours after online publication and is updated daily on week days.
Initial download of the metrics may take a while.