Fig. 5
Download original image
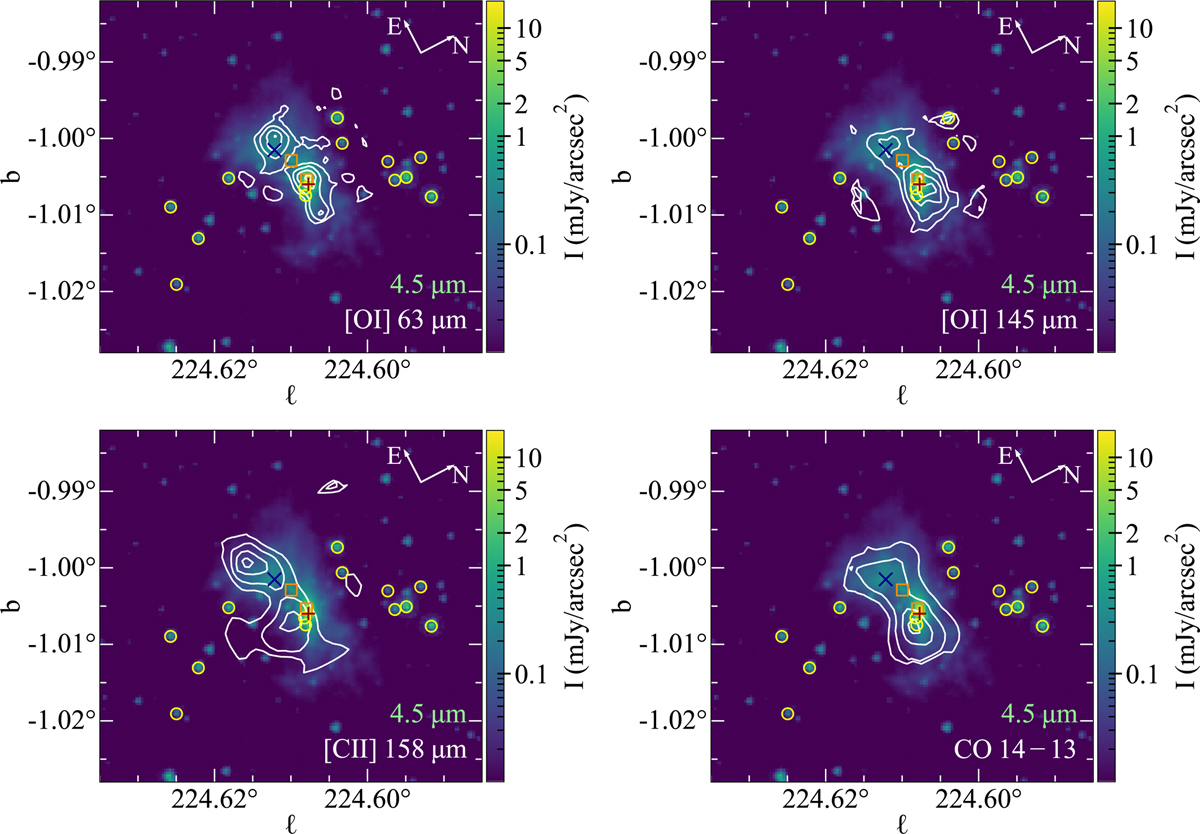
FIFI-LS contour maps of the [O I] lines at 63.2 and 145.5 μm, the [CII] line at 157.7 μm, and the CO 14-13 line at 186 μm (white contours) on top of the continuum emission at 4.5 μm from Spitzer/IRAC. The contours show line emission at 25%, 50%, 75%, and 95% of the corresponding line emission peak. The “+” and “×” signs show the positions of the dense cores A and B, respectively. The orange squares show the positions of two YSO candidates with envelopes, and the yellow circles show the positions of the remaining YSOs (Sect. 4.5).
Current usage metrics show cumulative count of Article Views (full-text article views including HTML views, PDF and ePub downloads, according to the available data) and Abstracts Views on Vision4Press platform.
Data correspond to usage on the plateform after 2015. The current usage metrics is available 48-96 hours after online publication and is updated daily on week days.
Initial download of the metrics may take a while.