Fig. 1
Download original image
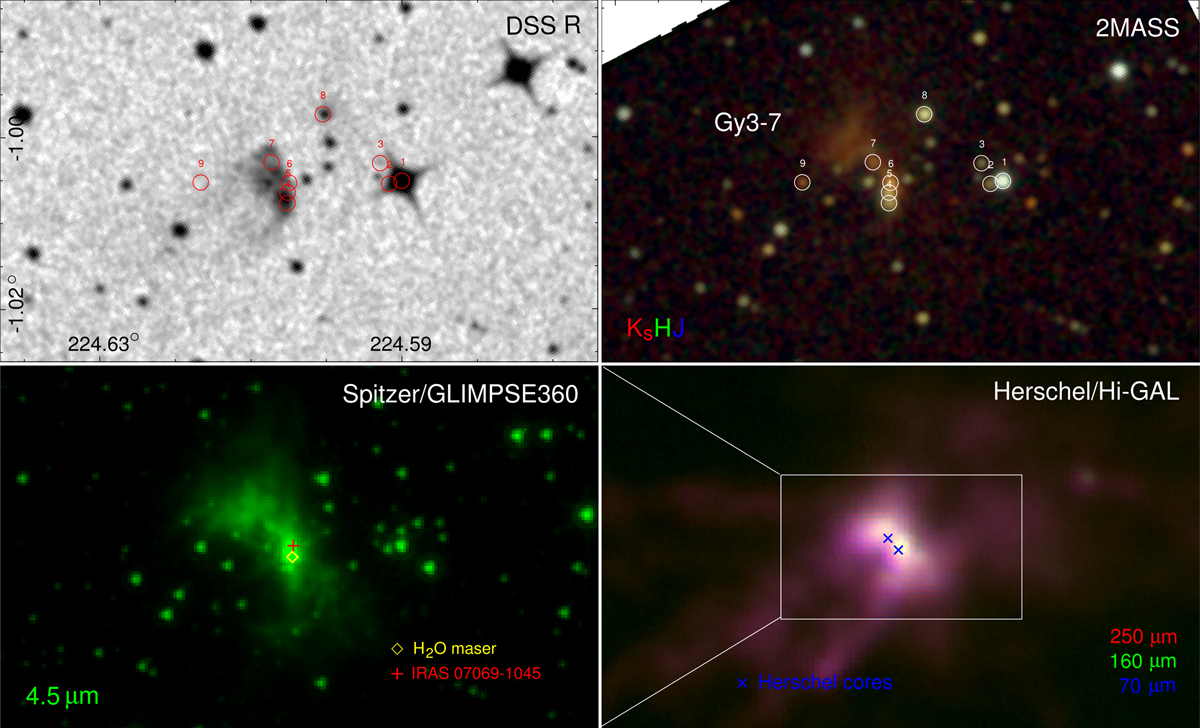
Digital Sky Survey (DSS) R (top left), 2MASS composite image using the J, H, and Ks filters (top right), Spfeer/GLIMPSE360 4.5 μm (Sewiło et al. 2019; bottom left), and Herschel/Hi-GAL composite image at 70, 160, and 250 μm (Elia et al. 2013; bottom right) of the Gy 3–7 cluster. Circles in the top panels show the positions of YSO candidates from Tapia et al. (1997). Yellow diamond and red cross in the bottom-left panel show the position of the H2O maser (Urquhart et al. 2011) and the IRAS source at the south-west side (IRAS 07069–1045), respectively. The blue “×” symbols in the bottom right panel show the positions of dense cores as traced by the H2 column density (Elia et al. 2013). Dense core in the west corresponds to IRAS 07069-1045.
Current usage metrics show cumulative count of Article Views (full-text article views including HTML views, PDF and ePub downloads, according to the available data) and Abstracts Views on Vision4Press platform.
Data correspond to usage on the plateform after 2015. The current usage metrics is available 48-96 hours after online publication and is updated daily on week days.
Initial download of the metrics may take a while.